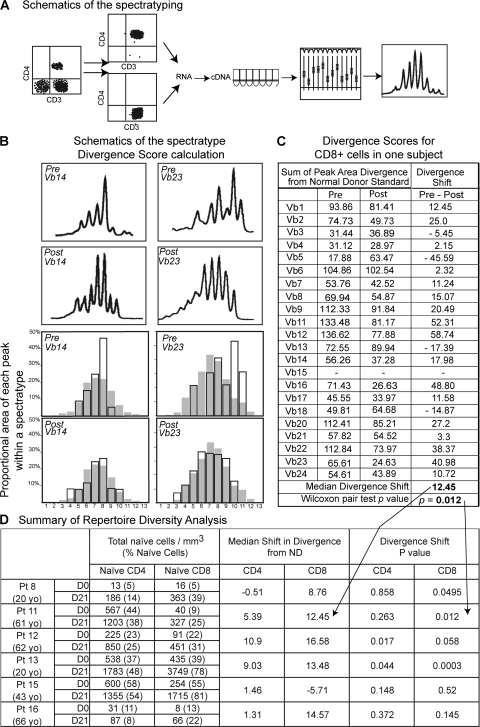
Figure 4.
rhIL-7 therapy increases TCR repertoire diversity by Vβ family spectratype analysis. (A) Schematic representation of the methodology. Vβ family spectratype analysis was performed for each of 6 subjects (3 of each cohort 3 and 4), separately on CD4+ and CD8+ cells by RT-PCR on RNA extracted from sorted T cells at baseline and at D21. The distributions of peaks for each Vβ family are graphically represented on a curve. (B) Schematic of divergence score calculation. Divergence from the normal donor standard was calculated for each Vβ family, separately for CD4+ and CD8+ cells, for each individual, at baseline and at day 21. Two Vβ families (Vβ14 on the left and Vβ23 on the right) are illustrated for the sorted CD8+ population in one individual (Pt 11), pre (rows 1 and 3), and post (rows 2 and 4) therapy. Overlays of histograms for the subject (no color) and the normal donor standard (in gray) illustrate how the divergence scores were calculated (see Materials and methods). (C)Divergence scores for CD8+ cells in one subject. Divergence scores are shown at baseline (pre) and day 21 (post) for each Vβ family, and a diversity shift was obtained (Pre-Post). The median diversity shift (a positive value indicates a shift toward greater repertoire diversity) and the P value of Wilcoxon pair test comparing the pre and post divergence scores are shown, and then incorporated into the summary in D. (D) Summary of repertoire diversity analysis. for each tested individual (age), shown at baseline (D0) and D21 are as follows: the total naive CD4+ and naive CD8+ cells counts; the median diversity shift for each CD4 and CD8 subsets of each individual and the P values of the Wilcoxon pair test indicating the likelihood that the calculated change in divergence scores for a particular subject's CD4+ or CD8+ cells between day 21 and baseline occurred by chance; P values <0.05 indicate a statistically significant increase in diversity toward normality between baseline and day 21 studies.

