
Fig. 10.
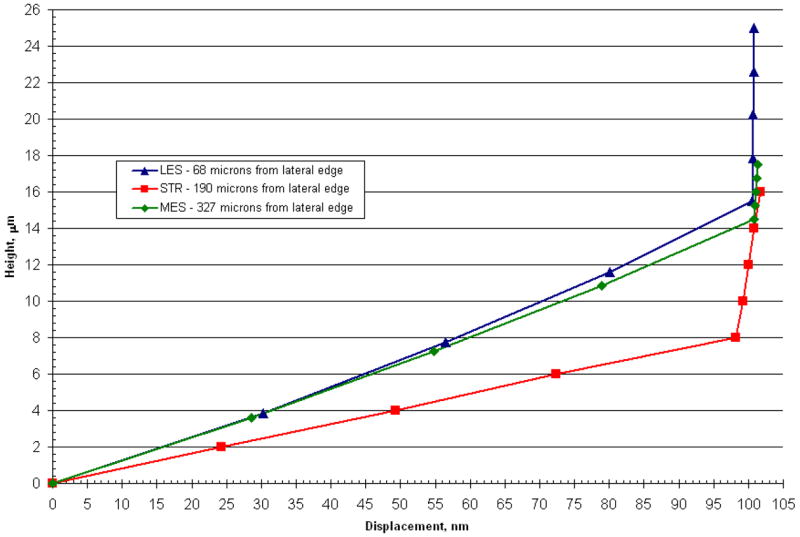
Displacement profile for 3 regions along the LM transect of CV3D OM (Utricle) model. This figure shows displacements through the GL and CFL for 3 regions along the LM transect in the CV3D model. Triangles represent the lateral extrastriola region (located 68 microns from the lateral edge), squares represent the striolar region (located 190 microns from the lateral edge) and diamonds represent the medial extrastriola region (located 327 μm from the lateral edge). Most of the shearing occurs in the more compliant column filament layer of the model. These displacement profiles are linear in a given region and reflect the general behavior throughout their region.