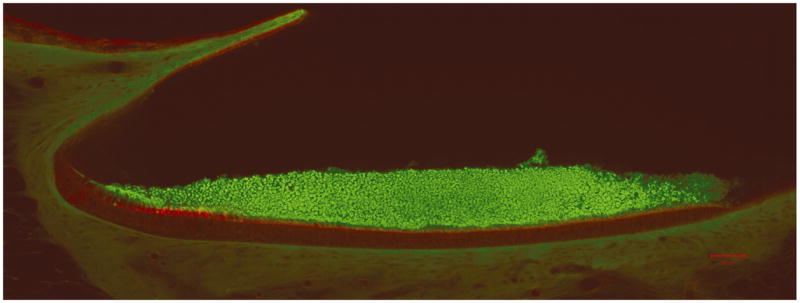
Fig. 3.

Confocal image of lateral-medial transect. This figure shows a confocal image of the lateral-medial transect of the left utricle (scale bar = 50 μm) [34]. The otoconial layer is stained green and the epithelial layer is stained red. Clearly visible in this image is the curvature of the LM transect. This figure was enlarged and the epithelial layer was curve fit by hand to determine curvature in this plane. Fig. 5 is used to determine individual layer thicknesses in the LM transect.
