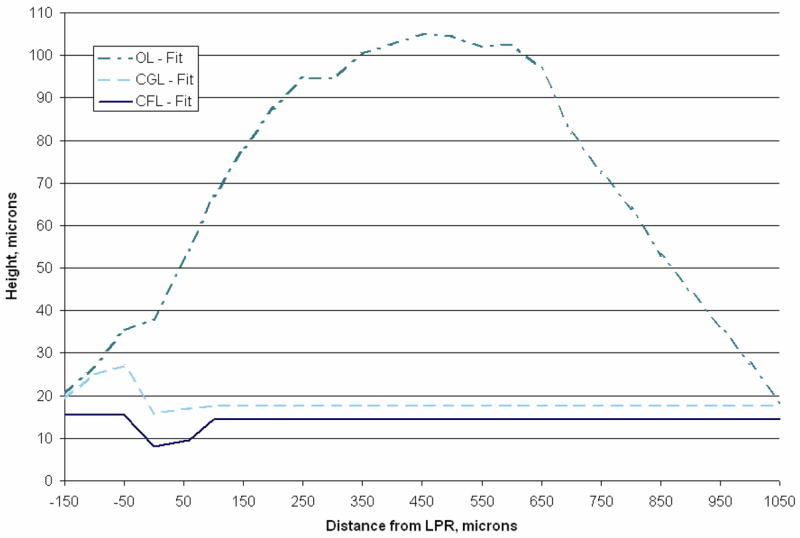
Fig. 4.

Lateral-medial transect layer thickness. Plotted in this figure are curve fits of lateral-medial transect layer thickness data from [34]. This blue line (solid) represents the column filament layer thickness relative to the epithelial layer. The striolar region is clearly visible here from negative 50 μm to positive 25 μm, and is the thinnest region in the CFL. The cyan line (dashed) represents the thickness of the compact gel layer. And finally the aqua line (dash-dot) represents the thickness of the otoconial layer along the lateral-medial transect. Layer thickness data between 950 and 1050 μm was linearly extrapolated from [34] to accommodate the 12 orthogonal cross sections (see Fig. 5) that were collected from the right utricle at 100 μm increments. Each discretized layer is used to construct the finite element models. The Quasi-2D model set layer thicknesses are based on this figure.
