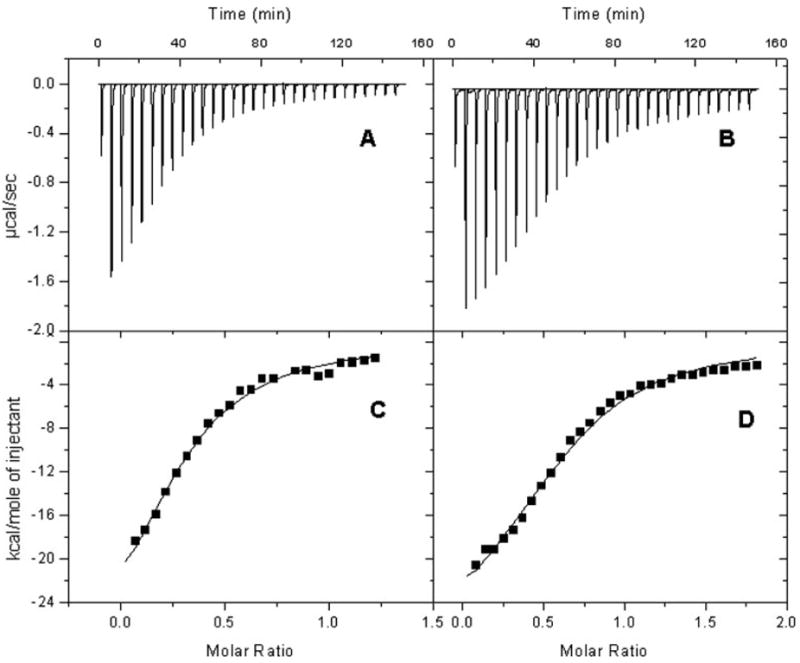
Fig. 6.

Isothermal titration calorimetry profiles of CBR1 V88 and CBR1 I88 with NADPH. Top, each peak shows the rate of heat release (μcal/s) after the interaction of CBR1 V88 (A) and CBR1 I88 (B) with the NADPH cofactor. Differences in titration profiles were significant at p < 0.001. Bottom, integration analysis for the titration profiles of CBR1 V88 (C) and CBR1 I88 (D). The solid line represents the best fit with a one-binding site model.
