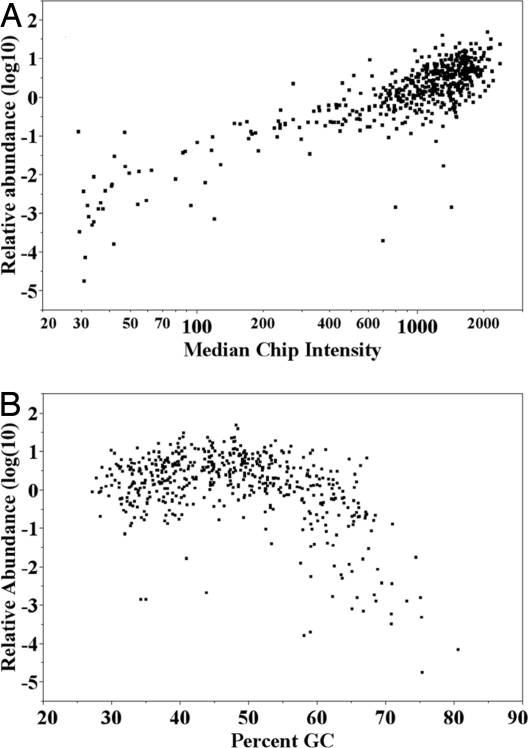
Fig. 4.
Quantitative distribution of exons in the multiplex PCR. (A) The relative abundance of each amplicon in the multiplex PCR products was estimated by quantitative PCR by using PCR primers specific to each amplicon. The log10 distribution of the amplicons was plotted against the median chip intensities for each amplicon. (B) The log10 distribution of the relative abundance with respect to the mean was calculated and plotted for each amplicon sorted by increasing percentage GC content.

