Figure 4.
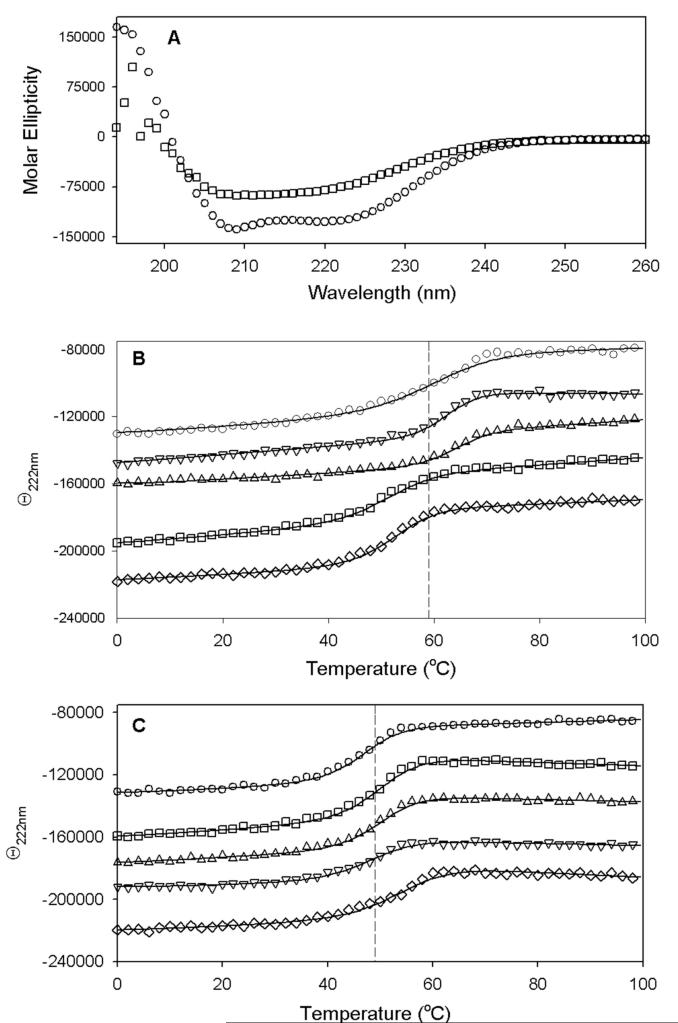
Protein stability determined by thermal denaturation in a circular dichroism spectrophotometer. Each protein (5 μM in anaerobic 10 mM MOPS, 25 mM NaF, pH 7.5) either contained the original complement of [2Fe-2S]2+ cluster or was reductively stripped of this cluster as described in the Materials and Methods. (A) Initial CD spectrum of WT [2Fe-2S]2+ BS recorded at 20 °C (○) and final melted spectrum recorded at 98 °C (□). (B) WT and R260 mutant proteins containing a [2Fe-2S]2+ cluster were subjected to a thermal melt from 0 to 98 °C monitored at 222 nm: WT (○), Arg260Ala (▽), Arg260His (△), Arg260Met (□), Arg260Cys (◇). (C) WT and R260 mutant apoproteins were subjected to a thermal melt from 0 to 98 °C monitored at 222 nm: WT (○), Arg260Ala (▽), Arg260His (△), Arg260Met (□), Arg260Cys (◇). Melt data are fit to a two-state cooperative unfolding model to determine the Tm values listed in Table 1.

