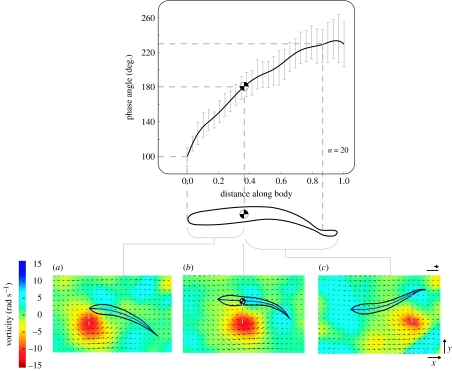
Figure 7.
(a–c) Time-series of a trout Kármán gaiting in a vortex street generated from a 5 cm cylinder to the left (not shown) illustrating the phase relationship between points on the body and the position of a drifting vortex. Fish outlines (black) and midlines (blue) are superimposed onto vorticity and velocity vector plots of the cylinder wake. Black arrows indicate flow direction (arrow orientation) and speed (scale arrow=56 cm s−1 or 4.5 body lengths per second; scale bar, 1 cm). Vorticity (radians per second) is colour-coded, where red represents counter-clockwise vorticity, green represents zero vorticity and blue represents clockwise vorticity. An arbitrary, external reference system was established to quantify the spatial relationship between the centre of the vortex and the position of a specific body point at a given time in the Kármán gait cycle (n=20 tail-beat cycles). (a) When a counter-clockwise vortex reaches the location of the head, the head is moving away from the vortex (phase relationship less than 180°; in this case, it is approx. 100°) due to the largely passive movement of the body with the lateral component of the flow induced by the previous clockwise vortex (not shown). (b) When the vortex drifts down to the point of the body where the COM is located, the COM is at its lateral-most excursion away from the vortex (phase relationship of 180°) and is about to start moving back towards the midline (dashed white line) of the wake. (c) When the vortex drifts down to the caudal peduncle, the caudal peduncle is moving towards the vortex (phase relationship greater than 180°; in this case, it is approx. 230°). Put another way, a phase relationship of 180° represents slaloming in between vortices, and 0 or 360° (not shown) represents vortex interception. The COM is shown as a chequered circle. Standard error bars are in light grey. Images are approximately 40 ms apart (Liao et al. 2003a).

