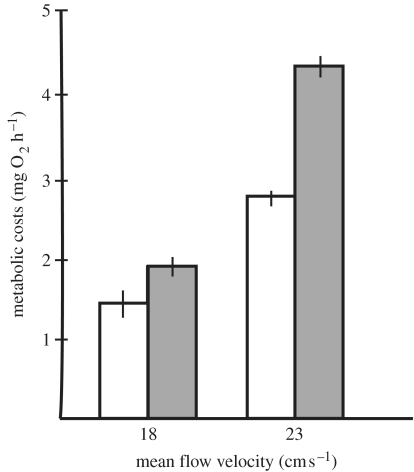
Figure 8.
Cost of turbulence as measured by oxygen consumption for juvenile Atlantic salmon. Turbulence was experimentally generated by varying flow velocities around two different mean velocity values. Oxygen consumption for salmon increases in turbulence (grey) compared to swimming in steady flows (white) for a given mean flow velocity. This trend is more dramatic at higher mean flow velocity. Vertical lines represent 95% confidence intervals (Enders et al. 2003).

