Abstract
There is a significant reduction in overall maximum power output of muscle at low temperatures due to reduced steady-state (i.e. maximum activation) power-generating capabilities of muscle. However, during cyclical locomotion, a further reduction in power is due to the interplay between non-steady-state contractile properties of muscle (i.e. rates of activation and relaxation) and the stimulation and the length-change pattern muscle undergoes in vivo. In particular, even though the relaxation rate of scup red muscle is slowed greatly at cold temperatures (10°C), warm-acclimated scup swim with the same stimulus duty cycles at cold as they do at warm temperature, not affording slow-relaxing muscle any additional time to relax. Hence, at 10°C, red muscle generates extremely low or negative work in most parts of the body, at all but the slowest swimming speeds.
Do scup shorten their stimulation duration and increase muscle relaxation rate during cold acclimation? At 10°C, electromyography (EMG) duty cycles were 18% shorter in cold-acclimated scup than in warm-acclimated scup. But contrary to the expectations, the red muscle did not have a faster relaxation rate, rather, cold-acclimated muscle had an approximately 50% faster activation rate. By driving cold- and warm-acclimated muscle through cold- and warm-acclimated conditions, we found a very large increase in red muscle power during swimming at 10°C. As expected, reducing stimulation duration markedly increased power output. However, the increased rate of activation alone produced an even greater effect. Hence, to fully understand thermal acclimation, it is necessary to examine the whole system under realistic physiological conditions.
Keywords: temperature, thermal acclimation, muscle mechanics, swimming performance, electromyography, nervous system
1. Introduction
It is a marvel of nature that animals can locomote with body temperatures varying by more than 20°C. Unlike a simple chemical reaction, where a decrease in temperature merely slows its rate, locomotion is a complex integrative process with muscular, neural, biomechanical and metabolic components. Since the temperature dependencies of the subprocesses of locomotion vary tremendously from independent (Q10=1) to highly dependent processes (Q10>5), it would seem to be an almost impossibly complex control problem for animals to perform coordinated locomotion when their body temperature is changed by 10 or 20°C.
As a prelude to the discussion of our recent work on the scup model, this atricle will first summarize our state of knowledge as of the late 1980s, as several reviews were written at that time (Bennett 1990; Johnston et al. 1990; Marsh 1990; Rall & Woledge 1990; Rome 1990). As our understanding of muscle function has improved so has our ability to understand how temperature affects the muscular system. Thus, the majority of the article will trace how improvements in understanding of muscle function since the late 1980s and early 1990s led to our ability to ask more subtle questions, and thereby dissect changes associated with temperature and appreciate remedies offered by thermal acclimation.
This article will then focus on my laboratory's more recent work, examining the effect of temperature on the muscle and locomotion of an excellent experimental model, the scup. Concentrating our research effort on this one species enabled us to obtain the detailed data necessary for addressing important integrative questions that was not available from other fish species. There have been a number of other researchers who have studied temperature effects and thermal acclimation of fish muscle (Johnston & Lucking 1978; Sidell 1980; Jones & Sidell 1982; Johnston et al. 1985; Curtin & Woledge 1988; Gerlach et al. 1990; Goldspink et al. 1992; Beddow et al. 1995). Restricting the discussion to scup will reveal some very subtle changes during acclimation that might be missed using a broader approach. Here, I also emphasize the historical nature of the improvements in our understanding of muscle function which were required to gain these new insights. In this article, we also restrict our analysis to the function of the aerobic swimming muscles, the red and pink muscle, during sustainable aerobic performance. Sustainable performance is an important trait of fish, such as scup, which migrate seasonally.
2. The effect of temperature on steady-state properties of muscle function and maximal locomotory performance
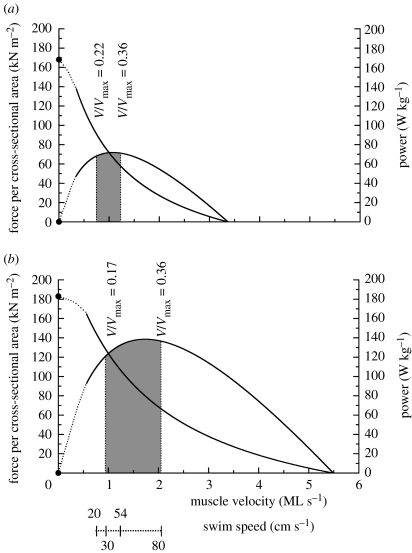
It has been known from the days of Hill (1938, 1964) that temperature, while having relatively little effect on force generation (Q10=1.1–1.2), has a large effect on the maximum velocity of shortening of muscle (Vmax; Q10=1.5–3) and a similarly large effect on the maximum power production (figure 1; see reviews, Bennett 1990; Rome 1990). Indeed, this difference in power production can be observed in maximal performance in simple forms of locomotion such as a frog jump. Using a force platform, one can relatively easily measure the muscle power production during jumping in frogs. Power generated during jumping increases with a Q10 of approximately 2.5 between 15 and 25°C, similar to that in isolated muscle. This increased power permits warm frogs to jump approximately 1.6-fold further than cold frogs (Hirano & Rome 1984; Lutz & Rome 1996).
Figure 1.
Influence of temperature on mechanical properties of scup red muscle and on their use during swimming. This figure shows the average (see note below) force–velocity and power–velocity curves of scup red muscle at (a) 10°C and (b) 20°C. (NB the dotted portion of the curves were not covered by their experiments and are fit by eye based on previous results). As muscle-shortening velocity during steady swimming was independent of temperature, we have placed the swimming speed axis on the graph as well. Thus, during steady swimming, the curves provide the power, force and muscle-shortening velocity as a function of swimming speed. The shaded regions represent the muscle-shortening velocity during steady swimming with red muscle. The dotted vertical lines at each temperature represent transition swimming speeds (see Rome et al. 1990). At slower swimming speeds than that of the left-most line, the scup used ‘burst and coast’ swimming with red muscle or their pelvic fins. At higher swimming speeds than that of the right-most line, the white muscle is recruited and the scup used burst-and-coast swimming. For each temperature, the V/Vmax at the transition points is given. Adapted from Rome et al. (1992b).
3. The effect of temperature on submaximal locomotory performance
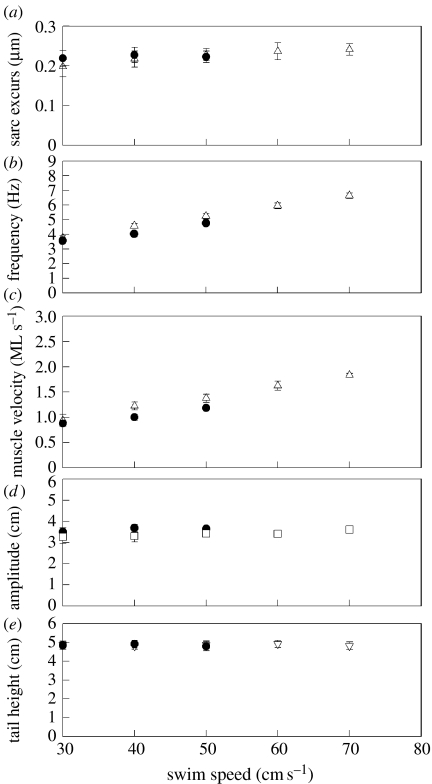
Focusing on a maximal performance, such as the one-shot ballistic movement of the frog jump, obscures perhaps the most dramatic aspect of the interaction between temperature, muscle function and locomotory performance. During submaximal performance, despite the large difference in maximum power production measured in isolated muscle, animals move with identical kinematics over a wide range of speeds (up to the point of maximal sustainable performance). This paradoxical result was first observed in running lizards (Rome 1982) and later carefully documented in fish (Rome et al. 1990, 1992a), which we switched to in an attempt to explain this apparent paradox. Figure 2 shows an example of this phenomenon: scup swimming at 10 and 20°C have exactly the same sarcomere length changes, tail-beat frequency and muscle-shortening velocity over the range of speeds where white muscle is not recruited (Rome et al. 1992a). It is particularly puzzling when one recognizes that drag has a Q10 of only 1.1 and hence the power required to swim at a given velocity is nearly independent of temperature. How then can the fish generate exactly the same movements at different temperatures while its muscles at the low temperature are capable of generating only one-half to one-third the power?
Figure 2.
(a) Sarcomere length excursion, (b) tail-beat frequency, (c) muscle velocity, (d) tail-beat amplitude and (e) tail height as a function of swimming speed at 10°C (filled circle) and 20°C (open triangle) in the posterior position of the fish. The influence of swimming speed on sarcomere length excursion was small and temperature had no effect. Temperature had no effect on tail-beat frequency but there was a linear increase of tail-beat frequency with swimming speed at the two temperatures. Muscle velocities increase linearly with swimming speed due to the increase in tail-beat frequency. Temperature generally had no effect on velocities. Neither swimming speed nor temperature had an influence on tail-beat amplitude or tail height.
4. Reconciling the temperature effect on muscle and swimming: compression of the recruitment order
This discrepancy between the isolated muscle results and those of the whole animal is due to an essential difference in the mode of stimulation between isolated muscle and whole animal experiments. In isolated muscle experiments, all the muscle fibres are maximally activated by virtue of direct electrical stimulation. Therefore, all muscle fibres are activated at each temperature. During animal locomotion, however, not all the muscle fibres are active at one time. Muscle fibres are arranged in motor units which are stimulated through motor neurons and the nervous system controls which motor units are active. Hence, it is probable that for a given swimming speed, the nervous system recruits more fibres and faster muscle fibre types at low temperatures to compensate for the influence of temperature on muscle function. This mechanism was termed compression of the recruitment order (Rome et al. 1984).
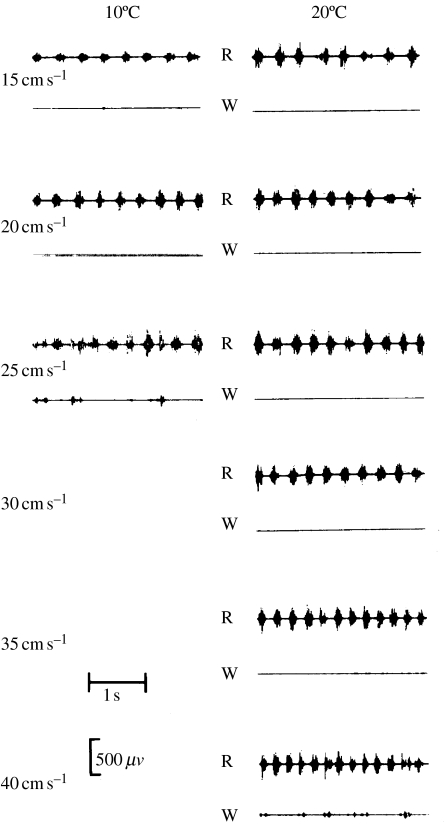
Fish provided an excellent experimental model to illustrate this mechanism because their different muscle fibre types, red (slow twitch aerobic) and white (fast twitch, anaerobic), are anatomically separated. Using electromyography (EMG), we were able to monitor the activity of the different fibre types during swimming with different muscle temperatures. Figure 3 shows typical results from a warm-acclimated carp swimming at 10°C, then at 20°C. We found that the recruitment order was fixed, i.e. at both the temperatures, only the red muscle was used at slow swimming speeds, whereas at faster speeds the white muscle was recruited as well. The important point, however, is that the white muscle was recruited at a considerably slower speed (mean=26 cm s−1) at 10°C than at 20°C (mean=46 cm s−1). Thus, it appeared that motor units are recruited in the same order at low and high temperatures, but that the order is simply ‘compressed’ into a narrower speed range at the low temperature.
Figure 3.
Electrical activity of red and white muscles during swimming at different speeds and temperatures in carp. At both temperatures, the carp recruited only the red muscle at low speeds and white muscle at higher speeds where the fish fatigued quickly. Hence, the same recruitment order was observed at both the temperatures; it was just compressed into a narrower speed range at 10°C.
Figure 4 illustrates this mechanism. Close examination shows that although compressing the recruitment order enables animals to maintain constancy of locomotion over a moderate range of speeds, there are limitations to performance at low temperatures. It is reasonable to expect that when swimming speed increases to a point where the anaerobic fibres must be recruited to generate the requisite mechanical power, the ATP used will be supplied anaerobically resulting in rapid fatigue. Thus, swimming speeds which require white muscle recruitment cannot be sustained. Since the mechanical power output of the aerobic muscle at 10°C is only approximately one-third to one-half that generated at 20°C, the anaerobic fibres must be recruited at a low speed, leading to the observed reduction in maximal sustainable swimming speed.
Figure 4.
Theorized recruitment of motor units as a function of swimming speed at (a) 10°C and (b) 20°C. Aerobic fibres, shaded motor units 1–3; anaerobic fibres, unshaded motor units 4–10. This schematically illustrates the compression of the recruitment order, and that all the aerobic fibres are recruited at a lower speed at 10°C, thus causing recruitment of the white muscle and rapid fatigue. Adapted from Rome (1990).
These limits cannot be altered unless some factor in the neuromuscular system changes to increase power at low temperatures. Carp have been shown to acclimate to cold temperatures by both speeding up the Vmax of their red muscle (by expressing different myosin heavy chains) and adding more red muscle (i.e. hypertrophy; Sidell 1980; Johnston et al. 1985; Goldspink et al. 1992). Therefore, it would be expected that at low temperatures, cold-acclimated carp could swim faster with their aerobic muscle than could warm-acclimated carp. This is indeed what was observed. Table 1 shows that at 10°C, the cold-acclimated fish could swim to speeds in excess of 30 cm s−1 before having to recruit their white muscle, whereas warm-acclimated fish had to recruit their white muscles at speeds of only 22 cm s−1. Since rapid fatigue accompanied the recruitment of the white muscle, this acclimation in effect reduced the Q10 for sustainable swimming speed from 2.0 to approximately 1.6 (Rome et al. 1985).
Table 1.
The effect of thermal acclimation on the speed of white muscle recruitment during swimming at 10 and 20°C. From Rome et al. (1985).
| acclimation temp | 10°C test temp white muscle recruit speed (cm s−1) | 20°C test temp white muscle recruit speed (cm s−1) |
|---|---|---|
| 8°C | 31 | 44 |
| 15°C | 26 | 46 |
| 26°C | 22 | 43 |
5. The effect of temperature on muscle-shortening velocity and V/Vmax during swimming
Up to this point in our discussion, the force and mechanical power generated by muscle were considered fixed, singular values for a given muscle fibre type at a given temperature. Hence, temperature effects on power could be easily described by a Q10 value. We realized that this was an oversimplification. The force, power (mechanical power output) and efficiency (mechanical power output/metabolic power input) of muscles are functions of V/Vmax, where V is the velocity at which muscle is shortening (figures 1 and 5). Owing to this fact, the Q10 for any of these parameters depends on the V at which the muscle is shortening. For instance, as illustrated in figure 5, at low velocities such as V1, the values for force generation, power production and efficiency are quite similar at low and high temperatures (i.e. Q10=∼1). At high velocities such as V2, by contrast, the Q10 for these parameters are very large.
Figure 5.
(a) Relative force, (b) power, (c) rate of energy usage and (d) efficiency as a function of relative shortening velocity for cold and warm muscles. Curves are shown for a cold fibre (solid) and a warm fibre (dashed). Respective Vmax values are shown on the velocity axis. V1 and V2 are arbitrarily chosen examples for low and high velocities. Adapted from Rome (1990).
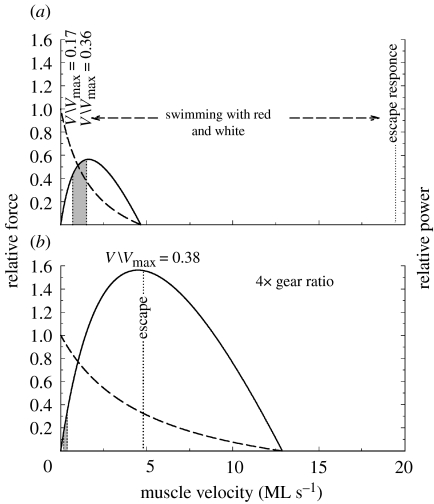
In vivo V/Vmax during swimming was determined for the first time in carp by Rome et al. (1988). Measurements of V/Vmax involved determining which muscle fibres are active at a given swimming speed, the muscle-shortening velocity in vivo and the Vmax of the different fibre types. The basic finding was that red muscle was used over a range of V values (V/Vmax=0.15–0.4) where it generated near-maximal powers with near-optimal efficiency. For faster movements, the white muscle had to be recruited because at these higher V values, power production of the red muscle became very low, falling to zero at the highest swimming speeds, whereas power production of the white muscle was near maximal owing to its higher Vmax and different fibre orientation which provided it with a fourfold higher gear ratio than red muscle (figure 6).
Figure 6.
V/Vmax in swimming carp. Force–velocity and power–velocity curves of the (a) red muscle and (b) white muscle. During steady swimming, the red muscle shortens at a velocity of 0.7–1.5 muscle lengths (ML) s−1 (shaded region) corresponding to a V/Vmax of 0.17–0.38 where maximum power and efficiency are generated. The red fibres cannot power the escape response because they would have to shorten at 20 ML s−1 (a) or four times their Vmax. The escape response is powered by the white muscle which, owing to its four-times-higher gear ratio, need shorten at only 5 ML s−1, which corresponds to a V/Vmax=0.38 where maximum power is generated (b). The white muscle would not be well suited to power steady swimming movements (shaded, b), as it would have to shorten at a V/Vmax of 0.01–0.03, where power and efficiency are low. Adapted from Rome et al. (1988).
Using a similar approach, we examined how temperature influences V/Vmax and how, in turn, V/Vmax may limit performance at different temperatures. Although it is clear that at low temperature the fish must run out of red motor units and recruit white muscle at a relatively low swimming speed, V/Vmax determines the swimming speed at which this occurs, and therefore the speed at which white muscle is recruited at different temperatures. We showed that both the highest V of the red muscle before white muscle recruitment and the Vmax of the red muscles have the same Q10 of 1.6 between 10 and 20°C. Thus, at both the temperatures, the highest V at which red muscle can be used before white muscle recruitment occurs is where V/Vmax=0.36 (figure 1). Since power, efficiency and force are all functions of V/Vmax, this value represents a V where increasing swimming speed would cause the mechanical power generated by the red muscle to begin to decline despite the requirements for additional power generation at the higher speeds. At higher speeds, the white muscle must be recruited to generate the additional power.
Swimming speed and muscle-shortening velocity are coupled mechanically in a manner that is independent of temperature. As Vmax of the red fibres increases with increasing temperature, the fibres can shorten more quickly and produce their maximum mechanical power (which is also higher) at faster swimming speeds, providing these animals with improved sustainable performance.
6. Limitations of steady-state analysis: optimized work-loop analysis
A limitation of the approach described above is that during cyclical locomotion such as fish swimming, muscles activate and relax during every tail beat. It has been shown that the kinetics of activation and relaxation can play a large role in the mechanical power production of muscle undergoing cyclical length changes (Josephson 1985). Furthermore, it is known that temperature has an even larger effect on the rate of sarcoplasmic reticulum (SR)–Ca2+ pumping (Q10=5 at low temperatures) than on steady-state shortening (Rall & Woledge 1990). Since SR–Ca2+ pumping is an important determinant of the kinetics of muscle relaxation (Rome et al. 1996), it is therefore possible that temperature might have a larger effect on muscle performing cyclical length changes than that performing simple steady-state movements.
Even now, there is not a completely accurate theoretical framework for integrating the different temperature effects on separate molecular events. However, Josephson developed an empirical approach to integrate steady- and non-steady-state properties of muscle: the optimized work-loop technique for synchronous muscle (Josephson 1985). Others have used the optimized work-loop technique and have hypothesized that it provides an accurate representation of muscle function during locomotion (e.g. Altringham & Johnston 1990; Johnson & Johnston 1991). However, as illustrated below, this also seemed to be a substantial oversimplification of muscle function during locomotion, because it does not take into account the biological and physical constraints which require muscle to be used under non-optimal conditions during locomotion.
In typical optimized work-loop analysis, one sets the frequency and then adjusts the stimulus duration, phase and strain to obtain the maximum power output at that frequency. We did this for scup red muscle and found that at 20°C the muscle can generate approximately 30 W kg−1, whereas at 10°C the muscle can generate approximately 13 W kg−1 (Rome & Swank 1992). The Q10 for net power so determined is approximately 2.3. One might therefore conclude that during swimming, the muscle of the 20°C fish can generate 2.3-fold more power than the muscle of the 10°C fish, and that swimming speed would be adjusted accordingly.
This reasoning, however, incorporates a logical error. It assumes that muscles operate optimally during locomotion at both low and high temperatures, but that turns out not to be true. For instance, at 20°C, the muscle generates maximum power at an oscillation frequency of 5 Hz, whereas at 10°C it generates maximum power at a frequency of 2.5 Hz (figure 7). Thus, if the values from optimized work loops were to hold, fish at 10°C should use their muscles at substantially lower frequencies than at 20°C. However, as shown in figure 2, scup swim with essentially the same tail-beat frequency at a given speed at both 10 and 20°C, and never even used their muscles during steady swimming at a frequency as low as 2.5 Hz.
Figure 7.
(a) Net power output at 10°C (open circles) and 20°C (filled circles) and (b) Q10 for power output as a function of oscillation frequency. Note that the appropriate swimming speed (from Rome et al. 1992a) for each oscillation frequency over which the scup use their red muscle is shown. Adapted from Rome & Swank (1992).
Thus, we expect the Q10 for power production in vivo to be larger than for optimized work loops—and in fact this is the case. The Q10 for power production varies with frequency from 1 to approximately 5, depending on the frequency. Over the range of speeds where fish swim at both the temperatures, the Q10 is 2.7–3.3, substantially higher than that derived from the Q10 of optimized work-loop experiments.
7. Constraining work-loop analysis to realistic conditions
However, this is just one of the parameters. When we measured power at a given frequency, we optimized the stimulation duration, phase and strain. Are these values optimized while swimming at different temperatures? Previously, our data suggested that they were not. For instance, in figure 8, the optimal stimulation duration values from the work-loop experiments at the time are shown by the dotted line. The optimal stimulus duty cycle declines with increasing frequency because there is less time for the muscle to relax. But dramatically, the optimal duty cycle is much shorter at 10°C than at 20°C. This is simply because muscle relaxes much more slowly at 10°C and a shorter duty cycle gives it more time to relax.
Figure 8.
EMG duty cycle as a function of tail-beat frequency (swimming speed) at 10°C (red filled circles) and 20°C (black filled circles). Note that there is no difference in duty cycle at 10 and 20°C, but that as swimming speed increases, EMG duty cycle declines. Note also that the swimming speed scale differs slightly from that in figure 7, as this scale was calculated for this particular fish. For comparison purposes, the stimulation duty cycles that we found produced optimal power output in the isolated muscle experiments are shown with dotted lines (red, 10°C; black, 20°C). Adapted from Rome & Swank (1992).
When we examined how long muscle is stimulated during swimming, we found that at 20°C the duty cycle was approximately equal to the optimal value. To compensate for low temperatures, the nervous system should drastically reduce the stimulus duty cycle at 10°C. However, in the one region of the fish we tested, the stimulation duration was precisely the same at 10°C as at 20°C (figure 8). Thus, at 10°C, the stimulation duration is far longer in the swimming fish than is optimal for generating mechanical power, and one would anticipate that, under these conditions, the muscle at 10°C would have tremendous difficulty in generating mechanical power—indeed, this is exactly what was observed.
When we set the oscillation frequencies and stimulation duration to values found in a swimming fish, and optimized strain and phase, we found that net power production is extremely low at 10°C, almost zero. Thus, the Q10 for power generation in vivo appeared to be closer to 10 rather than the 2.3 suggested from optimized work loops.
This finding brings up a number of interesting and perplexing issues, not the least of which is how do fish generate power for swimming at low temperatures?
8. In vivo work-loop analysis
Although these power values should be closer to the actual muscle power during swimming, they were not generalizable to the whole fish. These results referred to only one region of the fish. We had previously shown that muscle function in swimming scup varies considerably in different regions of the fish. Not only do stimulation duration, phase and strain vary dramatically along the length of the fish, but so do the contractile properties of the red muscle (Rome et al. 1993). The magnitude of this longitudinal variation in muscle function appears to vary between species and muscle fibre type (Altringham et al. 1993; McGlinchey et al. 2001; Thys et al. 2001; Coughlin et al. 2004).
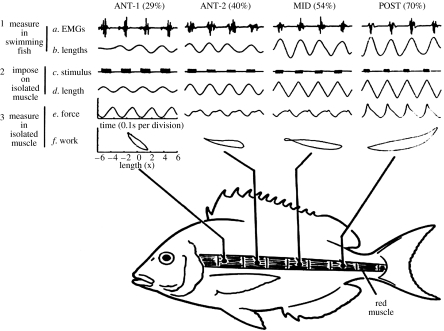
Thus, to have a more complete understanding of power production during swimming, it is necessary to: (i) measure, in fish swimming at different temperatures and speeds, the muscle EMG duration, phase and strain at different positions along the length of the fish and then (ii) remove the muscle from each position and drive it through the appropriate stimulation and length-change conditions and measure the resulting power production (figure 9). This approach is a fundamentally different measure than the optimized work-loop technique in which step (i) is completely omitted, and the stimulation duration, phase and strain are altered without reference to their values during locomotion.
Figure 9.
Length changes, stimulation pattern, force production and work output of red muscle during swimming. Step 1 was to measure in a swimming (80 cm s−1) fish the (a) EMGs and (b) length changes for the red muscle at four places along the length of the fish pictured. Step 2 was to impose on muscle bundles isolated from these four positions the (d) length changes and (c) stimulation pattern that were observed during swimming. Step 3 was to measure in the isolated muscle the resulting (e) force production and (f) work production. Traces a to e are all functions of time. Trace f is a plot of force produced against length changes where the area of the enclosed loop is the work produced during a tail-beat cycle. This value is much larger in the POST than in the ANT-1 position. Adapted from Rome et al. (1993).
We recognized that the problem at low temperatures is that muscle takes so long to relax. We knew from the optimized work-loop experiments that stimulus duty cycle must be decreased to obtain a reasonable power output. Thus, a simple solution for fish swimming at low temperatures is for the nervous system to reduce the stimulation duty cycle. So we asked does the nervous system compensate for temperature in this way?
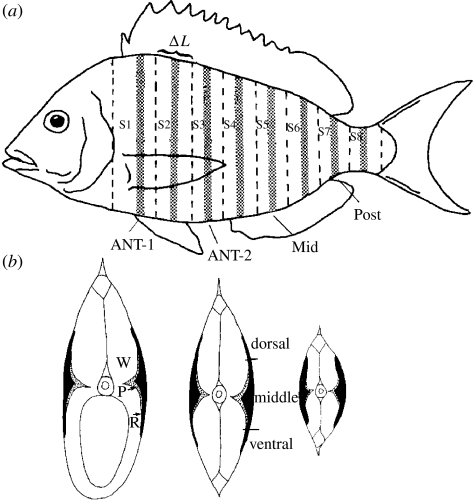
Measurement of the EMG duration at four locations along the length of the fish (ANT-1, ANT-2, MID and POST; 29, 40, 54 and 70%, respectively, of the distance from the nose to the tail) showed that scup do not decrease the stimulus duty cycle at low temperatures. To compensate for temperature in this fashion, the duty cycle would have to be reduced to a very low level, an easily distinguishable difference that was not observed.
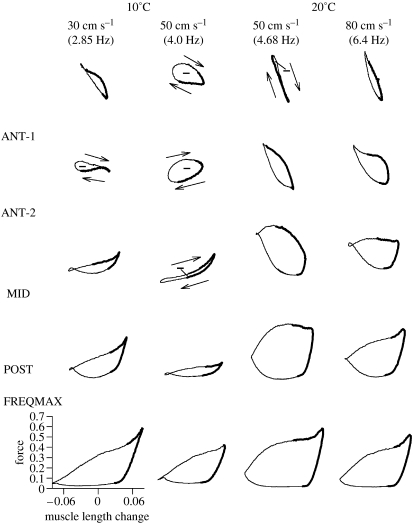
We would further anticipate that not reducing the stimulus duration would have drastic consequences in terms of mechanical power production, and indeed it did. Muscle at 10°C generates very little power (figures 10 and 11). The work per cycle is signified by the area of the anticlockwise work loop (Figure 10). At 30 cm s−1 (or 2.85 Hz), the muscle generates a small amount of mechanical power in all but the ANT-2 position, where the clockwise work loop signifies net negative work. At 50 cm s−1 (or 4 Hz), negative work is performed in all regions but the posterior region, where only a very small amount of power is generated. At 20°C, by contrast, a great deal of work is performed particularly in the POST section.
Figure 10.
Representative work loops for all in vivo conditions. The first four rows of each column show the work loops generated by a red muscle bundle from each position when driven under four sets of in vivo conditions (as measured in Swank & Rome 2000). The 80 cm s−1 data at 20°C are from Rome et al. (1993). The bottom row (FREQMAX) shows work loops generated when muscle length change, stimulus duration and phase were optimized to generate maximum power at the stated in vivo oscillation frequency and temperature. The timing of the stimulus relative to the total length-change cycle is represented by the thickening of the loop. Loops denoted by a negative sign generated net negative work and progress in a clockwise direction, whereas unmarked loops generated net positive work and progressed in the clockwise direction. Force was normalized to isometric force at 20°C. The x- and y-axes in the bottom left-hand graph represent scale bars for all the work loops. The muscle used for the bottom row (FREQMAX) was an ANT-1 bundle. This muscle was driven at the same frequency as the muscles above it, but the stimulation and length-change conditions were optimized for that frequency. Hence, the low work output at 10°C is not due to an inability of the muscle to generate power, but due to the in vivo conditions. Adapted from Rome et al. (2000).
Figure 11.
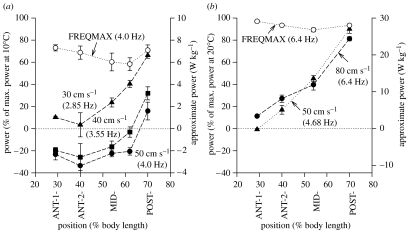
In vivo power generated by muscle bundles from different positions along the fish at different swimming speeds and temperatures. (a) 10°C and (b) 20°C. Note that power is extremely dependent on position and is generally far smaller than the maximum power that the muscle could generate at the stated in vivo oscillation frequency (FREQMAX) except in the POST position at certain speeds. Power is expressed as a percentage of the maximum power-generating ability of the muscle at the experimental temperature (left y-axis). The right y-axis shows the approximate absolute power generated by the muscles expressed in W kg−1 (note the difference in scale at 10°C when compared with 20°C). Note also that the absolute power scale is only approximate because values at each temperature are normalized for maximum power averaged over all the positions. Data at 80 cm s−1 at 20°C are from Rome et al. (1993). Adapted from Rome et al. (2000).
It is important to recognize that the small work loops at 10°C are not a reflection of the inability of 10°C muscle to generate work at these operating frequencies. To the contrary, the muscle is able to generate substantial amounts of mechanical work at these frequencies when the stimulation and length-change conditions are optimized (bottom row of figure 10).
When we look at the results in summary form, we see two very distinct patterns (figure 11). At 10°C, muscle generates very little mechanical power (figure 11a). In fact, while swimming with a speed of 40 or 50 cm s−1, all the regions of the fish, except for the most posterior, generate negative mechanical work. By contrast, at 20°C, very large mechanical work can be generated (figure 11b; note the difference in scales on the right ordinate).
The Q10 for power generation is very large. In the POST region, the Q10 is between 4 and 10 depending on swimming speed, and in the anterior region, the Q10 actually becomes indeterminate at some speeds, because no positive power is generated at 10°C. This large difference in power output is for two reasons. First, low temperature reduces the maximal mechanical work that the muscle can generate by approximately 2.3-fold (Rome & Swank 1992). Second, there is a dramatic short fall due to non-optimal stimulation and length-change conditions during swimming at low temperatures. At frequencies equivalent to 50 cm s−1, the 10°C muscle is capable of generating 70% of its maximum values (FREQMAX, upper curve, figure 11), but only generates approximately 15% in the best case in the POST region and generates negative work in the rest of the fish. By contrast, at 20°C, the muscle generates nearly its maximal power in the POST region (figure 11b). In addition, there is a dramatic fall in power at both temperatures as you move anteriorly.
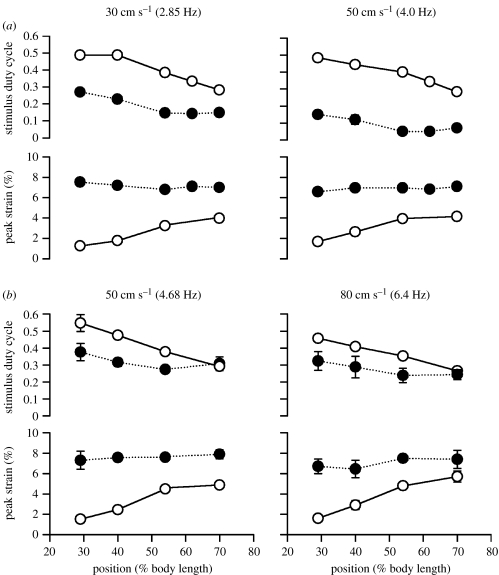
What makes in vivo conditions non-optimal at low temperatures and in the anterior at all temperatures? For each frequency and position along the fish, the optimized conditions are shown in solid symbols whereas those measured in vivo are shown as open symbols (figure 12). As can be seen, the in vivo stimulation duration is far longer than the optimal at 10°C, and this gets even worse as swimming speed, and hence tail-beat frequency, increases. At 20°C, by contrast, the in vivo stimulation curves become fairly close to the optimal condition. Figure 12 also shows that the in vivo conditions become worse at both temperatures as you move more anteriorly. The low power output of the anterior muscle is principally due to extremely small strains (in the order of 1–2%, due to increased stiffness of the fish), which are much lower than the optimal 6–7%.
Figure 12.
Comparison of stimulus duty cycle and strain values that maximize power (‘optimized’; filled symbols, dotted lines) with values measured in vivo (open symbols, solid lines) at (a) 10°C and (b) 20°C. The difference was greatest at the anterior positions and at 10°C. In addition, at 10°C, increased swimming speed led to a greater difference between optimal and in vivo conditions (t-test on difference of means, p<0.001). Results from manual analysis of EMG duration (circles) are shown for all temperatures and speeds.
9. Pink muscle provides much needed power at cold temperatures
The inability of red muscle to power swimming at low temperatures was perplexing, as fish were able to swim well, kinematically indistinguishable from swimming at 20°C. We performed a sensitivity analysis on the in vivo conditions measured, in which we purposely altered the conditions to the extremes of measurement error. We then drove isolated muscle under these extreme conditions to determine if any reasonable systematic error in our measurements of stimulation duration, strain or phase might significantly improve power production. It did not.
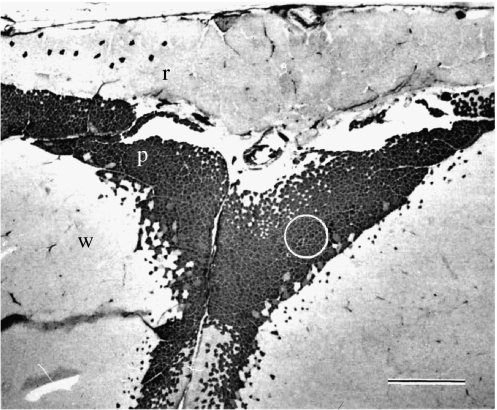
As we knew from electromyography that the white muscle was not being recruited at these swimming speeds, the only option left to explain this apparent paradox was pink-muscle recruitment. Historically, the positioning of the pink muscle, a layer between the red and the white (figure 13; Zhang et al. 1996), has made it difficult to find and dissect pure bundles. This is why before our studies, little was known about pink-muscle mechanics, only that it had a higher myofibrillar ATPase than red muscle (Johnston et al. 1977), suggesting that it may be faster. Furthermore, little was known about the recruitment of pink muscle, just an early study suggesting that it was initially recruited at intermediate speeds (Johnston et al. 1977).
Figure 13.
Cross-section of the scup myotomal muscle at the ANT-2 position stained with myosin ATPase (alkali pre-incubation, pH 10.2). Pink fibres are stained dark, unstained small fibres are red muscle fibres and unstained large fibres are white muscle fibres. The red, pink and white muscle layers are labelled r, p and w. The lateral margin of the fish is up, and dorsal is to the left. Scale bar is 1.0 mm. The circle represents the region from which muscle bundles of relatively pure pink fibre content were extracted. Adapted from Coughlin et al. (1996).
To be able to dissect bundles of pink muscle which were pure in fibre type and to be able to place EMG electrodes precisely in the pink muscle, we needed a detailed atlas of the muscle of scup (figures 13 and 14). With the atlas, we could develop an experimental strategy for pinpointing the pink muscle (Zhang et al. 1996). As will be discussed later, knowing the quantitative distribution of the different fibre types also permits us to integrate power production over the length of the fish.
Figure 14.
(a) Schematic of the scup showing the location of the steaks that were cut from the fish (S1–S8; dotted boundaries). ΔL, thickness of the segments (see text). Hatching refers to where the steak was sectioned. (b) The cross-sections of steaks from the anterior (ANT-2), middle and posterior position of the fish, showing the locations of each fibre type (R, red; P, pink; W, white). Adapted from Zhang et al. (1996).
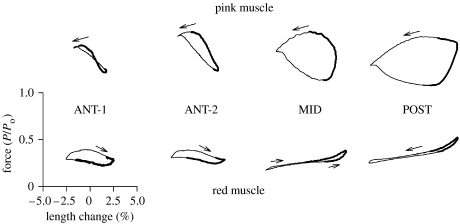
We first studied the mechanics of the pink muscle and found that when compared with red muscle at a given temperature, pink muscle had a 1.3-fold faster Vmax and activation rate, and 2.0- to 2.8-fold faster relaxation rate at 20 and 10°C, respectively (figure 15). These attributes enabled the pink muscle to generate 1.1- to 1.5-fold higher maximum power output than red muscle during oscillatory contractions at 10 and 20°C, respectively. The optimal frequency (where maximum power is achieved) was 1.5-fold higher for pink muscle than for red at both temperatures. When driven under the in vivo conditions, these attributes permitted the pink muscle to generate far greater power than the red muscle at 10°C and approaching what the red muscle could do at 20°C. Figure 16 shows representative work loops found under in vivo conditions. These and other data show that the pink muscle is capable of generating far more mechanical power under in vivo conditions at 10°C than can red. Whereas the red muscle could generate net positive power in only the POST position at 50 cm s−1 at 10°C, the pink muscle could generate positive power in all positions.
Figure 15.
(a) Tetanus and (b) twitch records at 20°C for red- and pink-muscle bundles. Individual traces were normalized to the peak force of that contraction. For each record, the stimulus (either a repeated train of pulses for tetanus or a single pulse for twitch stimulation) was optimized such that the muscle bundle generated maximum force. Stimulation began at time zero. (a) The stimulation duration of the tetanus is represented by the thickening of the force trace. Since pink muscle do not maintain steady tetanic force as long as red-muscle, tetanus stimulation duration was limited and the broad plateau observed for the red-muscle tetanus record is not observed in pink-muscle tetanus records.
Figure 16.
Work loops from red and pink muscle when run under in vivo conditions at 10°C. Red- and pink-muscle bundles were activated with their respective in vivo length change and stimulation pattern. Area of the loop signifies work per cycle. As all cycles are at the same frequency, the 4.0 Hz tail-beat frequency for swimming at 50 cm s−1, the area of the loop also indicates relative power generation. The work loops for the red muscle at ANT-1, ANT-2 and MID positions are primarily clockwise signifying that negative work is being produced. For the red muscle at the POST position and all the pink muscle, the loops are anticlockwise signifying positive work is being produced. Adapted from Coughlin & Rome (1996).
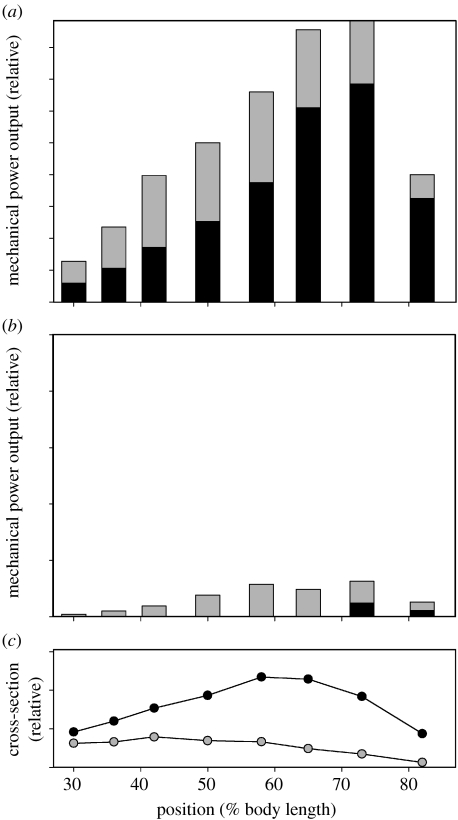
To assess the effect of pink-muscle power generation on relative power production of the total musculature, the product of the mass-specific power output of pink muscle and its mass at each position was integrated along the length of the fish (figure 17). Strikingly, despite the fact that pink muscle has only one-third the mass of red, during swimming at 50 cm s−1 at 10°C, the pink muscle is capable of generating approximately six times more power than the red muscle (figure 17b). In contrast, at 80 cm s−1 at 20°C (figure 17a), the pink muscle generates only approximately 50% of that generated by the red (reflecting the pink muscle's much lower volume, see figure 17c). Hence, at low temperatures, the pink muscle makes a very large contribution to the power requirements during sustainable swimming.
Figure 17.
Comparison of total power generated by scup red and pink musculature at the maximum sustainable swimming speeds at (a) 20°C (80 cm s−1) and (b) 10°C (50 cm s−1). The height of each bar of the histogram corresponds to the power that the red (black shading) and pink (grey shading) musculature generates at that location (i.e. the product of muscle mass and mass-specific power production). Pink muscle data are from Coughlin & Rome (1996). Note that these pink-muscle measurements were made on bundles taken exclusively from the ANT-2 position because it is not possible to obtain pure pink-muscle bundles from other positions. Note also that the in vivo conditions for the POST position were approximated as those of the red muscle at this position because there was not sufficient pink muscle at the POST from which to record EMGs. (c) The relative cross-section of the red (black circles) and pink muscle (grey circles) along the length of the fish (data from Zhang et al. 1996).
10. Acclimation of scup to low temperatures
Having explained how fish can swim at low temperatures even though little power is generated by the red muscle, we were still left with the problem that the red muscle generates little mechanical power at low temperature. Since pink muscle is less aerobic than red and is presumably more energetically costly, there may be an advantage to delay the onset of pink-muscle recruitment to higher swimming speeds. This would require the red muscle to increase its ability to generate mechanical power at low temperatures.
The new appreciation of the problems associated with cyclical locomotion at low temperatures raises possibilities for exploring new mechanisms by which thermal acclimation can improve muscle and swimming performance. First, the contractile properties of the muscle could change. It has been previously shown that in one species, carp, there was an increase in the Vmax of muscle during cold acclimation (Johnston et al. 1985). Further, it is possible that substantial improvement in power could be achieved without changing Vmax (or steady-state power production), by speeding up the kinetics of relaxation and possibly activation. It is known that variations in intrinsic isometric relaxation rates are possible without changes in Vmax. For instance, in scup, isometric relaxation rate varies approximately twofold along the length of the fish despite Vmax being independent of position (Rome et al. 1993; Swank et al. 1997).
Second, changes in the output of the nervous system could play a significant role in improving muscle and locomotory performance at low temperatures. The mechanical power output of the muscle at a given tail-beat frequency (i.e. oscillation frequency) could be increased considerably if the nervous system simply reduced the time a muscle was stimulated to compensate for slower relaxation rates at cold temperature (Rome & Swank 1992). The reduced stimulus duty cycle would permit the muscle to be more relaxed during re-lengthening, and hence generate greater net mechanical power. As discussed above, such a reduction in the stimulus duty cycle does not occur in warm-acclimated scup during acute exposure to cold temperatures (Swank & Rome 2000), but it is possible that it might occur in response to long-term thermal acclimation.
Finally, it is possible that the amount of red muscle could increase (i.e. hypertrophy). In previous studies of striped bass, it was found that there was a 50% increase in the quantity of red muscle in cold-acclimated fish (Jones & Sidell 1982). This increase, in turn, permitted the red muscle to generate greater power and thereby swim faster prior to initial white-muscle recruitment (Sisson & Sidell 1987). Similar hypertrophy was found in goldfish (Sidell 1980) and other species. However, given our understanding of mass-specific power output along the length of scup, having more red muscle generating negative power at 10°C would not permit scup to swim faster. An increase in muscle mass would be useful only in the POST region of the fish (where positive power is generated). Examination of a detailed atlas of the fibre-type distribution showed in fact that there was no increase in red muscle associated with thermal acclimation (Zhang et al. 1996), and hence we could dispense with this as a possible explanation for scup.
11. Acclimation of the nervous system
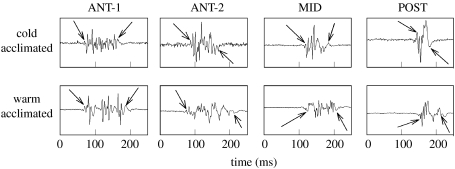
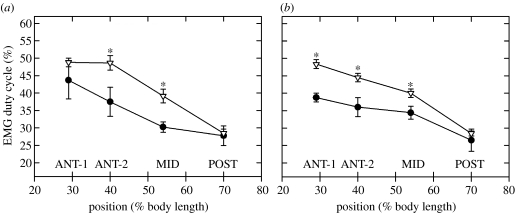
EMG recordings from scup swimming at a water temperature of 10°C revealed significant differences in duty cycle between acclimation groups. The duty cycles of cold-acclimated scup at the ANT-1, ANT-2 and MID positions were significantly shorter than warm-acclimated scup by an average of approximately 18% at a swimming speed of 50 cm s−1 (figures 18 and 19). At 30 cm−1, the duty cycle was 24 and 18% shorter in cold-acclimated scup than warm-acclimated scup at the ANT-2 and MID positions, respectively (figure 19).
Figure 18.
EMG traces from the four longitudinal electrode positions showing the longer EMG duration of warm-acclimated when compared with cold-acclimated scup red muscle. The start times of the ANT-1 bursts were used to align the traces. Both fish were swum at 50 cm s−1 in 10°C water. Arrows mark start and stop times of the EMGs determined manually. Adapted from Rome & Swank (2001).
Figure 19.
EMG duty cycle for cold- and warm-acclimated scup swimming at (a) 30 cm s−1 and (b) 50 cm s−1 in 10°C water. Duty cycle was EMG duration divided by tail-beat frequency and was significantly shorter in the cold-acclimated scup. Asterisk, significant difference at a given body position due to acclimation; filled circles, cold acclimated; inverted open triangles, warm acclimated. Adapted from Rome & Swank (2001).
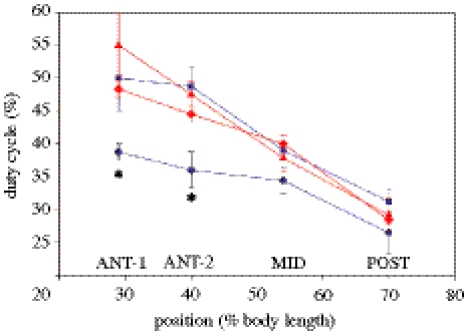
The differences in EMG duty cycle were due to an earlier cessation of activity, as there was no change in the phase of stimulus onset time with acclimation. Although significant differences were observed while swimming at 10°C, there were no differences in EMG characteristics between warm- and cold-acclimated scup at a swimming temperature of 20°C. At 50 and 80 cm s−1, the EMG duty cycles for cold-acclimated fish were nearly identical to those for warm-acclimated fish. Further, in warm-acclimated fish, the stimulus pattern was the same at 10°C as at 20°C swimming temperatures (figure 20). Thus, of the four possible combinations of acclimation and swimming temperatures, the stimulus pattern is the same in three cases (warm acclimated at 10 and 20°C swimming temperature and cold acclimated at 20°C). Only the cold-acclimated fish at a swimming temperature of 10°C has a different (lower) stimulus duty cycle (figure 20).
Figure 20.
Stimulus duty cycle under the four acclimation-temperature and acute-temperature conditions. For the warm-acclimated 10°C (red, filled diamond) and 20°C (red, filled triangle) swimming conditions and the cold-acclimated 20°C (blue, filled square) swimming conditions, the stimulus duty cycles were nearly the same (there was no statistical difference). There was however a significant reduction in duty cycle in the cold-acclimated 10°C (blue, filled circle) swimming conditions (significant at ANT-1 and ANT-2 but not significant at POST). Asterisk, significant reduction. Adapted from Rome & Swank (2001).
One interpretation is that the stimulus pattern for swimming at 20°C represents a ‘default condition’. This may reflect the fact that scup spend much of their most active time in warmer temperatures (Neville & Talbot 1964). Perhaps, the stimulus duty cycle for warm-acclimated fish at 10°C does not differ from this ‘default’ because warm-acclimated scup spend very little time at cold temperatures. Only the cold-acclimated nervous system working at 10°C differs from this default. This modification may be crucial during long migrations at cold temperatures (Neville & Talbot 1964) and may represent the expression of a different set of genes (Goldspink et al. 1992; Cole & Johnston 2001; Hall et al. 2003)
12. Acclimation of red muscle
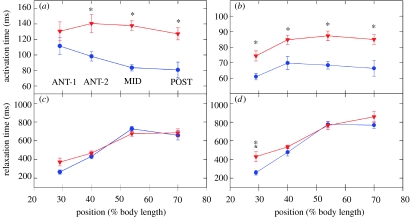
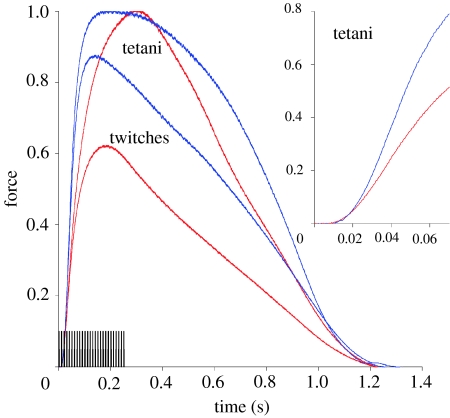
We did not observe any change in the steady-state properties of the red muscle. Both the maximum isometric force and Vmax of the red muscle were the same in cold- and warm-acclimation groups. Further, contrary to our expectations, there was no speeding up of the relaxation (figure 21c,d). Instead, we found that when compared with warm-acclimated muscle, cold-acclimated isometric activation rates for tetani were 1.43-, 1.65- and 1.58-fold faster for ANT-2, MID and POST bundles, respectively (figures 21a and 22). Similarly, the twitch activation rates were approximately 1.25-fold faster than the warm-acclimated muscle for all four positions. Although this was a dramatic difference, it was not obvious that this change should necessarily increase power production during locomotion.
Figure 21.
(a) Tetanic activation time and (c) tetanic relaxation time (Tr,90-10) of cold- and warm-acclimated scup red muscle. Activation time was statistically significant due to acclimation (asterisk). Relaxation differences due to acclimation were not statistically significant. Similar differences between the acclimation groups (b, activation time and d, relaxation time) were obtained from twitches as well. Red filled inverted triangle, warm acclimated scup; blue filled circle, cold acclimated scup. Adapted from Swank & Rome (2001).
Figure 22.
Isometric twitches and tetani from warm- (red) and cold-acclimated (blue) scup red muscle under identical conditions. Bundles are from the MID position. Stimulus duration for the tetanus is 250 ms. Force levels were normalized to maximum isometric force of each muscle. Note the longer time to reach maximum force and lower twitch tetanus ratio in the warm-acclimated muscle. Inset: force records for tetani shown with a faster time base. Adapted from Swank & Rome (2001).
13. Statistical significance versus physiological significance
We have observed two statistically significant changes in the cold-acclimated fish (shorter EMG duration and faster activation kinetics). The advantage of the in vivo work-loop approach is that, instead of being left to only hypothesize what these changes might mean, we can determine their physiological significance: measure the power increase and dissect out the individual contributions made by these mechanisms to increases in vivo muscle power production.
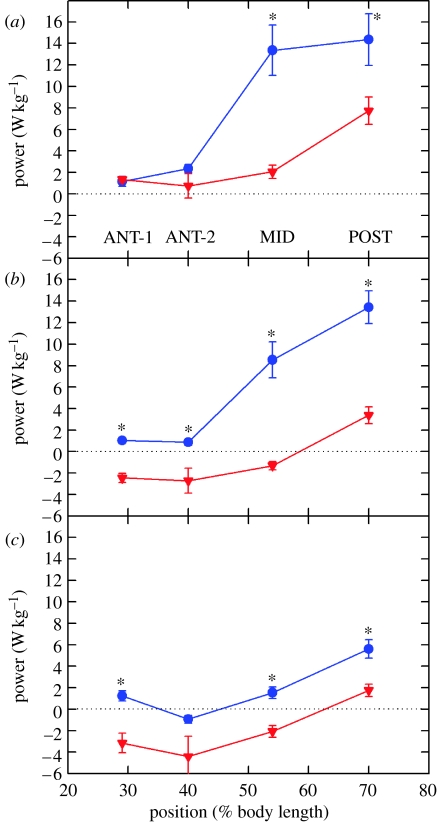
There is a large increase in power production in the red muscle of cold-acclimated fish. Except for the ANT-2 at 50 cm s−1, red-muscle bundles from all four positions of cold-acclimated scup produced positive power for swimming at all speeds (figure 23) when driven through their in vivo stimulus and length change conditions measured at 10°C. Isolated muscle bundles from the ANT-1 and ANT-2 positions generated between 0 and 2.5 W kg−1 at oscillation frequencies measured from scup swimming at speeds of 30, 40 and 50 cm s−1, while muscle bundles from the MID and POST regions produced up to 14.4 W kg−1 (figure 23). These values are in sharp contrast to those from warm-acclimated muscle bundles. As discussed above, when driven through their 10°C in vivo conditions at 40 and 50 cm s−1, they produced no net power at any position except the POST where power was quite low (figure 23b,c).
Figure 23.
In vivo power from scup red muscle. Muscle bundles from cold-acclimated scup were driven through cold-acclimated in vivo conditions at 10°C and muscle from warm-acclimated scup was driven through warm-acclimated in vivo conditions at 10°C. The swimming speeds were (a) 30 cm s−1 (2.85 Hz), (b) 40 cm s−1 (3.5 Hz) and (c) 50 cm s−1(4.0 Hz). Power differences due to acclimation at all swimming speeds were statistically significant. Asterisk, significant difference due to acclimation at individual position; blue filled circle, cold-acclimated muscle and cold-acclimated conditions; red filled inverted triangle, warm-acclimated muscle and warm-acclimated conditions. Error bars are one standard error. Adapted from Swank & Rome (2001).
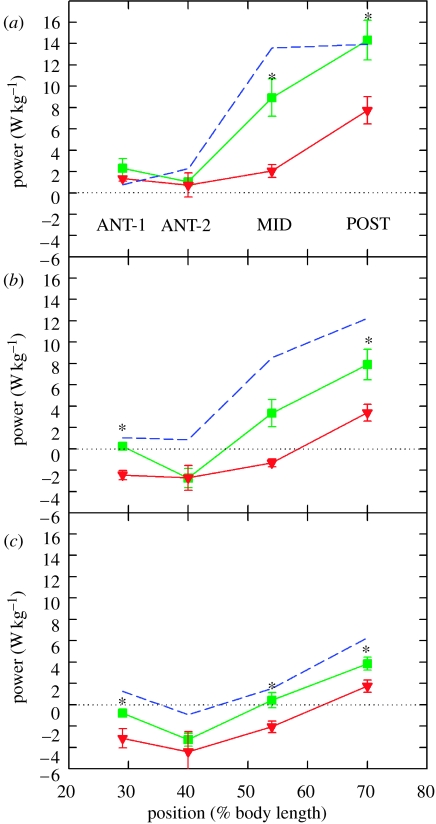
We found that acclimatory changes in both the contractile properties of the muscles and the output of the nervous system were responsible for this increase in power. First, in general, cold-acclimated muscle generated more power than the warm-acclimated muscle when both were driven through identical in vivo conditions (figure 24). This signifies that there was some change in the properties of the red muscle during thermal acclimation.
Figure 24.
Increased power due to acclimation-induced changes in red-muscle mechanical properties. In these experiments, warm- and cold-acclimated bundles were run under the same warm-acclimated in vivo conditions. The swimming speeds were (a) 30 cm s−1, (b) 40 cm s−1 and (c) 50 cm s−1. Power differences due to muscle acclimation at all swimming speeds were statistically significant. Asterisk, significant difference due to acclimation at individual positions; blue dashed lines, cold-acclimated muscle and cold-acclimated conditions; green filled square, cold acclimated muscle and warm acclimated conditions; red filled inverted triangle, warm-acclimated muscle and warm-acclimated conditions. For comparison to the total change in power output associated with cold acclimation, power output of the cold-acclimated muscle running under cold-acclimated conditions is shown as a dashed blue line. Adapted from Swank & Rome (2001).
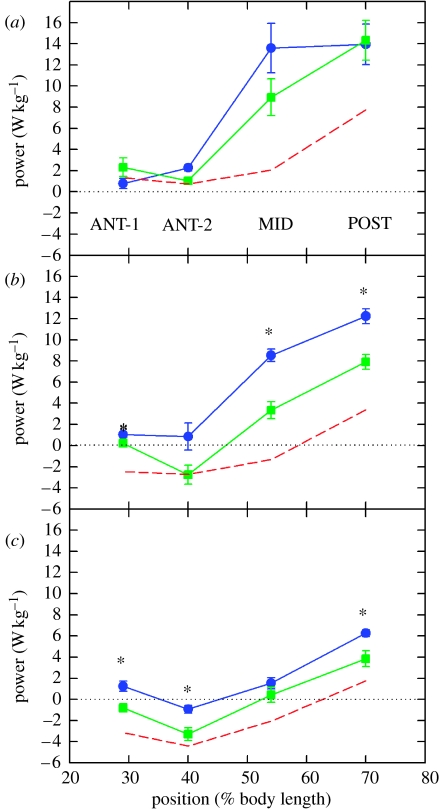
Second, although overall there was a large increase in power output associated with thermal acclimation of the muscle, it did not account for the total increase in power associated with thermal acclimation of the whole locomotory system of the fish. The remaining increase in power output with cold acclimation was from the changes in the output of the nervous system that favoured power production at cold temperatures. We found that changes in the in vivo conditions contributed significantly to the higher power production of cold-acclimated red muscle. As shown in figure 25, at 40 and 50 cm s−1, cold-acclimated muscle produced significantly higher power when activated under cold-acclimated 10°C in vivo swimming conditions than when activated under warm-acclimated conditions. When driven though cold-acclimated 40 cm s−1 conditions, MID and POST muscle bundles produced 2.5- and 1.5-fold higher power, respectively, when compared with warm-acclimated conditions (figure 25b). Under 50 cm s−1, cold-acclimated conditions, there was a 1.6-fold increase in power output for the POST. Cold-acclimated conditions also significantly raised power output from ANT-1 and ANT-2 muscle (figure 25c). In contrast, at 30 cm s−1, there was not a statistically significant difference in power generation between in vivo conditions from the two acclimation groups (figure 25a).
Figure 25.
Increased power due to acclimation-induced changes in in vivo conditions (primarily EMG duty cycle). In these experiments, cold-acclimated red muscle was run under both cold- and warm-acclimated in vivo conditions. The swimming speeds were (a) 30 cm s−1, (b) 40 cm s−1 and (c) 50 cm s−1. This comparison shows the contribution of changes in the nervous system output to the increase in power production in cold-acclimated fish. Asterisk, significant difference due to different in vivo acclimation conditions at individual positions; blue filled circle, cold-acclimated muscle and cold-acclimated conditions; green filled square, cold-acclimated muscle and warm-acclimated conditions. For comparison with the total change in power output associated with cold acclimation, power output of the warm-acclimated muscle running under warm-acclimated conditions is shown as a dashed red line. Adapted from Swank & Rome (2001).
14. Dissecting the mechanisms for the power increase
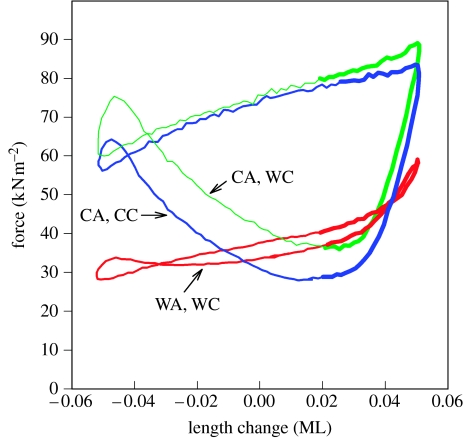
Cold acclimation resulted in changes to the muscle and to its stimulation pattern that dramatically increased the amount of power that scup were able to produce with their red muscle at 10°C. The work loops in figure 26 illustrate how exactly these changes combine to lead to greater power production at the POST position. The warm-acclimated bundle (WA) when driven through its in vivo conditions for 10°C (WC) generated a very flat loop with nearly equal positive and negative work. This resulted in limited net power of only 1.4 W kg−1. A cold-acclimated muscle (CA), with its faster activation rate, when run under the same conditions, generated a much fuller loop with much more positive and net work (9.1 W kg−1). Having a faster activation rate permits force to rise very rapidly to a high level by the beginning of shortening. Thus, the cold-acclimated muscle can generate much more positive work. The importance of the reduced stimulation duration can also be seen by comparing the cold-acclimated muscle driven under the WC and cold-acclimated conditions (CC). Turning off the stimulus approximately 5 ms earlier in the CC caused little change in the positive work, but substantially reduced the large negative work observed under the warm-acclimated conditions, by allowing the muscle to relax more fully before being re-lengthened. This resulted in a substantial increase in the net work generated (12.6 W kg−1).
Figure 26.
Power generated by warm- and cold-acclimated muscle. The two muscle bundles are from the POST position of warm-acclimated (WA) and cold-acclimated (CA) scup and were driven through POST in vivo conditions for a 40 cm s−1 swimming speed. The warm-acclimated conditions (WC) were 3.6 Hz, 5.4% strain, −54° phase and 85 ms stimulus duration. Cold-acclimated conditions (CC) were 3.5 Hz, 5.4% strain, −56° phase and 80 ms stimulus duration. Power generation for WA, WC (red) was 1.4 W kg−1; 9.1 W kg−1 for CA, WC (green); and 12.6 W kg−1 for CA, CC (blue). Note that for this particular swimming speed and anatomical position, there is only a small change in stimulus duty cycle and thus there is only a moderate enhancement in work production associated with the cold-acclimated conditions. Adapted from Swank & Rome (2001).
15. Q10 for power production depends on position and swimming speed
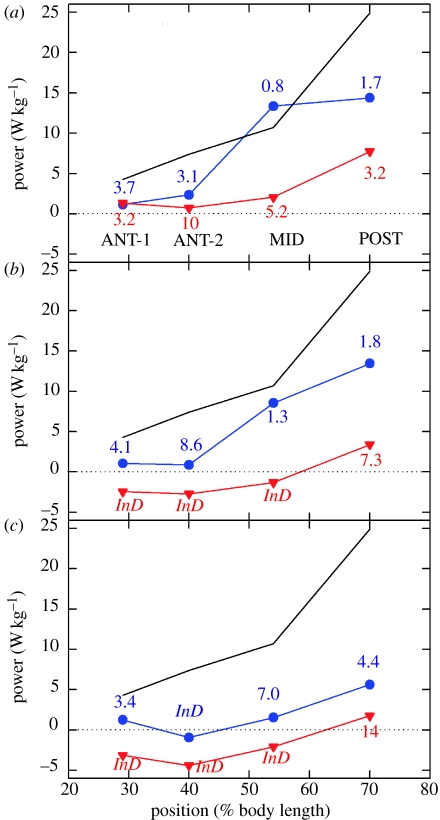
The level of power increase, and the extent to which the muscle and nervous stimulation changes contributed, varied considerably with muscle position and swimming speed. The largest increases in power were at the POST and MID positions, which provide the majority of power for swimming in scup (Rome et al.1993); it should be noted that the longitudinal distribution of mechanical power production by red and pink muscle appears to vary depending on the style of swimming employed by the particular species (Wardle et al. 1995; Coughlin 2000; Katz et al. 2001; McGlinchey et al. 2001; Thys et al. 2001; Syme & Shadwick 2002). The increase in power in these regions, particularly at 30 and 40 cm s−1, is quite large. The large magnitude of power increase with cold acclimation can be best appreciated when compared with muscle performance at 20°C. Figure 27 shows power output at a swimming speed of 80 cm s−1 at 20°C in warm-acclimated scup (black line). Although the Q10 values for power production were generally large or indeterminate for the warm-acclimated fish, the Q10 values for the cold-acclimated fish were often modest. For instance, the Q10 for MID and POST power production at 30–40 cm s−1 ranged between 0.8 and 1.8. The fact that there is so much variation in Q10 requires re-evaluation as to whether it is a useful concept in the field of in vivo power production by muscles.
Figure 27.
The temperature dependence of power output during swimming. Muscle power output at (a) 30 cm s−1 (2.85 Hz), (b) 40 cm s−1 (3.5 Hz) and (c) 50 cm s−1 (4.0 Hz) and 10°C in cold-acclimated fish (blue) and warm-acclimated fish (red) are compared with power output during swimming at 80 cm s−1 and 20°C in warm-acclimated fish (black line; data from Rome et al. 2000). Q10 values (power at 20°C/power at 10°C) are given in the appropriate colour for each position and swimming speed. InD signifies that the Q10 is indeterminate, i.e. the power output at 10°C is negative. Adapted from Swank & Rome (2001).
16. Whole animal power production
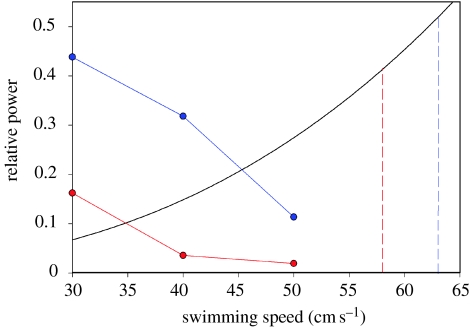
Cold acclimation appears to significantly increase the power output of the red muscle during swimming at cold temperatures, particularly in the MID and POST regions of the fish. To better assess the effect of thermal acclimation on overall power generation during steady swimming, we determined the power generated by the red musculature by integrating the product of mass-specific power output and red muscle mass at each position along the body of the fish (as outlined in Rome et al. 2000). By comparing these power values to the approximate power required for swimming (black curve, figure 28), we conclude that it is unlikely that warm-acclimated scup (red curve, figure 28) can power swimming at 40 or 50 cm s−1 at 10°C with just their red muscle (Coughlin & Rome 1999; Rome et al. 2000) but that warm-acclimated fish would be capable of swimming at only 30 cm s−1 at 10°C with its red muscle alone. This is in agreement with recruitment of pink muscle (Coughlin & Rome 1999).
Figure 28.
The relative total power output of the red musculature as a function of swimming speed at 10°C. The blue curve represents power output of the red musculature from cold-acclimated fish and the red curve represents power output from warm-acclimated fish. Relative power output of the red musculature was determined by integrating the power output of the red muscle along the length of the fish, and then normalizing to the integrated power output of the red+pink muscle of fish swimming at 80 cm s−1 and 20°C (as outlined in Rome et al. 2000). We chose power output at 80 cm s−1 and 20°C as an estimate of the maximum power output that the combined red and pink musculature can generate during swimming. This seems reasonable because 80 cm s−1 is close to the swimming speed of initial white-muscle recruitment at 20°C, and we know that both pink and red muscle are recruited at this swimming speed (Coughlin & Rome 1999). The relative power required for swimming at slower speeds (black curve) was calculated based on the assumption that power required is proportional to the cube of swimming speed (Webb 1978): relative power required is proportional to (speed/80)3. This figure shows that there is a very large increase in total red-muscle power output associated with thermal acclimation, which probably permits the cold-acclimated fish to swim at 40 cm s−1 with the red muscle alone, whereas the warm-acclimated fish cannot. However, at swimming speeds of 58–63 cm s−1, the red musculature generates very little power and only a small proportion of the total power required to swim at that speed. Adapted from Swank & Rome (2001). Red dashed line, warm-acclimated white muscle recruitment speed (58 cm s−1); blue-dashed line, cold-acclimated recruitment speed (63 cm s−1).
Cold acclimation increases power generation considerably. Using the same normalization procedure, we calculated that, at 30, 40 and 50 cm s−1, the red musculature of cold-acclimated fish (blue curve, figure 28) could generate 2.7-, 8.9- and 5.8-fold more total power, respectively, than that in warm-acclimated fish. Based on the power required for swimming, these data suggest that unlike warm-acclimated fish, the red muscle in the cold-acclimated fish should be able to power swimming to at least 40 cm s−1 (figure 28), but this remains to be determined (see §18). However, this analysis also suggests that the red muscle of cold-acclimated fish would still be unable to power swimming at 50 cm s−1.
This analysis has several important implications for swimming performance. First, pink muscle must be recruited to swim at 50 cm s−1 at 10°C in both acclimation groups. As discussed by Rome et al. (2000), pink muscle, owing to its much faster relaxation as well as faster activation and Vmax, can generate more mechanical power under in vivo conditions at cold temperatures (Coughlin & Rome 1996; Coughlin et al. 1996). Hence, although its volume is only approximately one-third of the red muscle, it generates an increasing proportion of the power for swimming as the fish swims faster. Second, EMG experiments on warm-acclimated fish (Coughlin & Rome 1999) have shown that pink muscle is substantially recruited by 40 cm s−1, as would be predicted from figure 28. As the cold-acclimated fish apparently generates enough power with its red muscle to power swimming at 40 cm s−1, we predict that during cold acclimation, the speed at which pink muscle is initially recruited would be shifted to higher speeds between 40 and 50 cm s−1.
This analysis also explains a curious result. Interestingly, we observed that the swimming speed of initial white-muscle recruitment was only slightly (approx. 10%, 63 versus 58 cm s−1) higher in the cold-acclimated fish, but this was not statistically significant (Rome & Swank 2001). One might imagine that the increased power output of the red muscle should translate to an increase in the speed at which white muscle is initially recruited. However, between 58 and 63 cm s−1, the power output of the red muscle would be quite small for both acclimation groups (probably less than 10% of the total power (red muscle+pink muscle) required for swimming). The reason is that the power required for swimming goes up substantially (figure 28), while power output of the red musculature drops dramatically. The power output of the red musculature from cold-acclimated fish drops fourfold between 30 and 50 cm s−1 (figure 28) and will probably continue to drop rapidly with increasing swimming speed, due largely to increased tail-beat (muscle oscillation) frequency (Rome & Swank 1992; Rome et al. 2000). Thus, even though the red musculature from cold-acclimated fish generates many-fold greater power than that from warm-acclimated fish, the fact that the red muscle makes such a small contribution to the total power generated at 58–63 cm s−1 explains why there is little or no increase in white-muscle recruitment speed.
Despite not increasing the initial speed of white-muscle recruitment, the ability of red muscle in cold-acclimated fish to generate higher power probably results in several important improvements in cold-temperature swimming performance at moderate cruising speeds. First, because the red muscle of cold-acclimated fish is able to generate far greater power during swimming, it is almost certainly more efficient (i.e. it generates greater mechanical power for a given metabolic energy input). Although we have not measured the efficiency of red muscle directly, the higher efficiency in cold-acclimated fish is readily apparent during swimming at a speed of 40 cm s−1. At this speed, the efficiency (mechanical power output/metabolic power input) of most of the red muscle in the warm-acclimated fish must be less than zero because the power output is negative. By contrast, the red muscle in the cold-acclimated fish generates positive work and thus must have a positive value for efficiency. Since the mechanical power required for swimming at a given speed is the same in both cold- and warm-acclimated fish, the higher efficiency probably results in the energetic cost of swimming at a given speed being significantly lower in cold-acclimated fish.
Second, red muscle has a higher mitochondrial density than pink muscle (Johnston et al. 1977; Johnston 1983), and thus a higher aerobic capacity and greater fatigue resistance. Being able to generate more power with the highly aerobic red muscle, and thereby requiring less power output from the less-aerobic pink muscle, may prolong the duration of steady swimming in cold-acclimated fish.
We hypothesize that at moderate cruising speeds, these changes enable the cold-acclimated fish to swim with a lower energy cost and with reduced reliance on the less fatigue-resistant pink muscle. Both of these abilities may increase the swimming speed at which prolonged aerobic muscle activity can occur, and thus reduce the travel time for the long seasonal migrations (several 100 km) in which scup engage.
17. Summary
When compared with the mid- to late 1980s, our understanding of muscle function and locomotory performance has improved, and thus our ability to appreciate the problems faced by fish swimming at different temperature has vastly improved, as has our ability to appreciate new mechanisms of compensation for temperature. Using improved techniques and our improved understanding of the muscular system, the principle findings are as follows:
In the 1980s, power output of muscle was thought to be a fixed value which had a Q10 of 2–3. This greatly underestimated the reduction in mechanical power production of red muscle during swimming at low temperatures. The combination of a large Q10 on activation and relaxation coupled with non-optimal stimulation durations results in very low power production.
During the 1980s, the only mechanisms thought to increase power production during cold acclimation were increased Vmax and hypertrophy of the red muscle. Our present work shows that during cold acclimation, power production can be greatly increased by two more subtle factors which were not appreciated in the 1980s: increased activation rate and reduced stimulation duration by the nervous system.
In the 1980s, pink muscle was viewed as a small contributor to power production during swimming owing to its low volume. Indeed, at warm temperatures, its contribution is modest. However, at cold temperatures, our work shows that pink muscle, with its much faster relaxation rate and faster activation rate and Vmax, plays a dominant role.
18. Future work
There are several main experiments which remain undone for furthering our understanding of the effects of temperature and thermal acclimation on muscle and locomotory performance.
When trying to evaluate the power production of muscle, we could only compare relative values (figure 28) because there were no techniques available for determining how much absolute hydrodynamic power is generated during swimming. However, recent advances in digital particle image velocimetry (DPIV; Wolfgang et al. 1999; Liao & Lauder 2000; Anderson et al. 2001; Drucker & Lauder 2001; Liao et al. 2003) may make this possible in the future. With this ability, we could examine quantitatively what proportion of the power needed for swimming is in fact generated by the red or pink muscles.
Further, it is crucial to test the hypotheses that (a) the improved power production of the red muscle during cold acclimation permits swimming to higher swimming speeds with the red alone (i.e. prior to pink muscle recruitment) and this, in turn, (b) permits scup to swim more efficiently (i.e. with a lower energetic cost).
The molecular changes which are responsible for the changes in the speed of activation need to be determined. Recent work (Coughlin et al. 2005) shows that in some fish species, there is a change in Troponin T (TNT) isoform along the length of the fish which correlates to a change in activation times. This raises the possibility that a change in expression of TNT, or some other myofibrillar protein, during thermal acclimation may be responsible for accelerating activation in red muscle from cold-acclimated scup.
It is important to determine the mechanism underlying the change in EMG duration during cold acclimation. We assume that the reduction in EMG duration coincides with a reduction in the duration of motor neuron stimulation. It would be important to verify this and to move more centrally to determine where in the nervous system this alteration occurs.
To fully understand acclimation in scup, it would be important to determine whether cold acclimation alters the mechanical characteristics of pink muscle or the simulation pattern in vivo as it does in the red muscle.
New technologies to track physiological function of animal locomoting in their natural environment (e.g. telemetry and satellite tracking) can provide important information about how the locomotory machinery is actually used and at what temperatures the muscular system must operate (Dewar et al. 1999; Block et al. 2001; Katz et al. 2001; Boustany et al. 2002). Further, by determining the thermal history of a given species, we can better assess which acclimatory changes are likely to occur in nature.
Finally, one of the most exciting areas of research on fish involves the use of the genetic model, zebrafish. Research carried out by Fetcho and colleagues, in particular, has addressed important aspects of motor control. By using confocal microscopy, Ca2+-sensitive dyes and lasers in the transparent zebrafish, Fetcho et al. (1997) have been able to determine the function and firing sequence of various nerve cells during the escape response (Fetcho et al. 1997; Hale et al. 2001; Ritter et al. 2001). More recently, Fetcho et al. (1997) have been able to engineer certain classes of cells to express Ca2+-sensitive dyes so that the development of complex connections between nerves can be determined (Higashijima et al. 2003; Liu et al. 2003). Finally, as the genetic approaches evolve, one would anticipate the ability to modify specific molecular aspects of muscle function (i.e. cross-bridge kinetics) and to explicitly determine its effect on muscle and locomotory performance at different temperatures.
Acknowledgments
This work was supported by NIH grants (AR38404 & AR46125), ONR grant (N000140310568) and a grant from the University of Pennsylvania Research Foundation. The author thanks his co-workers on these experiments, particularly Douglas Swank, David Coughlin, David Corda and Guixin Zhang. The author thanks Louis Flynn, Andy Mead and Dr James Marx for reviewing and helping to prepare the manuscript.
Footnotes
One contribution of 18 to a Theme Issue ‘Environmental constraints upon locomotion and predator–prey interactions in aquatic organisms’.
References
- Altringham J.D, Johnston I.A. Modelling muscle power output in a swimming fish. J. Exp. Biol. 1990;148:395–402. [Google Scholar]
- Altringham J.D, Wardle C.S, Smith C.I. Myotomal muscle function at different locations in the body of a swimming fish. J. Exp. Biol. 1993;182:191–206. [Google Scholar]
- Anderson E.J, McGillis W.R, Grosenbaugh M.A. The boundary layer of swimming fish. J. Exp. Biol. 2001;204:81–102. doi: 10.1242/jeb.204.1.81. [DOI] [PubMed] [Google Scholar]
- Beddow T.A, van Leeuwen J.L, Johnston I.A. Swimming kinematics of fast starts are altered by temperature acclimation in the marine fish Myoxocephalus scorpius. J. Exp. Biol. 1995;198:203–208. doi: 10.1242/jeb.198.1.203. [DOI] [PubMed] [Google Scholar]
- Bennett A.F. The thermal dependence of locomotor capacity. Am. J. Physiol. 1990;259:R253–R258. doi: 10.1152/ajpregu.1990.259.2.R253. [DOI] [PubMed] [Google Scholar]
- Block B.A, et al. Migratory movements, depth preferences, and thermal biology of Atlantic bluefin tuna. Science. 2001;293:1310–1314. doi: 10.1126/science.1061197. doi:10.1126/science.1061197 [DOI] [PubMed] [Google Scholar]
- Boustany A.M, Davis S.F, Pyle P, Anderson S.D, Le Boeuf B.J, Block B.A. Expanded niche for white sharks. Nature. 2002;415:35–36. doi: 10.1038/415035b. doi:10.1038/415035b [DOI] [PubMed] [Google Scholar]
- Cole N.J, Johnston I.A. Plasticity of myosin heavy chain expression with temperature acclimation is gradually acquired during ontogeny in the common carp (Cyprinus carpio L.) J. Comp. Physiol. B. 2001;171:321–326. doi: 10.1007/s003600100179. doi:10.1007/s003600100179 [DOI] [PubMed] [Google Scholar]
- Coughlin D.J. Power production during steady swimming in largemouth bass and rainbow trout. J. Exp. Biol. 2000;203:617–629. doi: 10.1242/jeb.203.3.617. [DOI] [PubMed] [Google Scholar]
- Coughlin D.J, Rome L.C. The role of pink and red muscle in powering steady swimming in scup, Stenotomus chrysops. Am. Zool. 1996;36:666–677. [Google Scholar]
- Coughlin D.J, Rome L.C. Muscle activity in steady swimming scup, Stenotomus chrysops, is a function of fiber type and body position. Biol. Bull. 1999;196:145–152. doi: 10.2307/1542560. doi:10.2307/1542560 [DOI] [PubMed] [Google Scholar]
- Coughlin D.J, Zhang G, Rome L.C. Contractile dynamics and power production of pink muscle of the scup. J. Exp. Biol. 1996;199:2703–2712. doi: 10.1242/jeb.199.12.2703. [DOI] [PubMed] [Google Scholar]
- Coughlin D.J, Spiecker A, Schiavi J.M. Red muscle recruitment during steady swimming correlates with rostral–caudal patterns of power production in trout. Comp. Biochem. Physiol. A Mol. Integr. Physiol. 2004;137:151–160. doi: 10.1016/s1095-6433(03)00285-x. doi:10.1016/S1095-6433(03)00285-X [DOI] [PubMed] [Google Scholar]
- Coughlin D.J, Caputo N.D, Bohnert K.L, Weaver F.E. Troponin T expression in trout red muscle correlates with muscle activation. J. Exp. Biol. 2005;208:409–417. doi: 10.1242/jeb.01375. doi:10.1242/jeb.01375 [DOI] [PubMed] [Google Scholar]
- Curtin N.A, Woledge R.C. Power output and force-velocity relationship of live fibres from white myotomal muscle of the dogfish, Scyliorhinus canicula. J. Exp. Biol. 1988;140:187–197. [Google Scholar]
- Dewar H, Deffenbaugh M, Thurmond G, Lashkari K, Block B.A. Development of an acoustic telemetry tag for monitoring electromyograms in free-swimming fish. J. Exp. Biol. 1999;202:2693–2699. doi: 10.1242/jeb.202.19.2693. [DOI] [PubMed] [Google Scholar]
- Drucker E.G, Lauder G.V. Wake dynamics and fluid forces of turning maneuvers in sunfish. J. Exp. Biol. 2001;204:431–442. doi: 10.1242/jeb.204.3.431. [DOI] [PubMed] [Google Scholar]
- Fetcho J.R, Cox K.J, O'Malley D.M. Imaging neural activity with single cell resolution in an intact, behaving vertebrate. Biol. Bull. 1997;192:150–153. doi: 10.2307/1542591. doi:10.2307/1542591 [DOI] [PubMed] [Google Scholar]
- Gerlach G, Turay L, Malik K.T.A, Lida J, Scutt A, Goldspink G. The mechanism of temperature acclimation in the carp: a molecular biology approach. Am. J. Physiol. 1990;259:R237–R244. doi: 10.1152/ajpregu.1990.259.2.R237. [DOI] [PubMed] [Google Scholar]
- Goldspink G, et al. Switches in fish myosin genes induced by environmental temperature in muscle of the carp. Symp. Soc. Exp. Biol. 1992;46:139–149. [PubMed] [Google Scholar]
- Hale M.E, Ritter D.A, Fetcho J.R. A confocal study of spinal interneurons in living larval zebrafish. J. Comp. Neurol. 2001;437:1–16. doi: 10.1002/cne.1266. doi:10.1002/cne.1266 [DOI] [PubMed] [Google Scholar]
- Hall T.E, Cole N.J, Johnston I.A. Temperature and the expression of seven muscle-specific protein genes during embryogenesis in the Atlantic cod Gadus morhua L. J. Exp. Biol. 2003;206:3187–3200. doi: 10.1242/jeb.00535. doi:10.1242/jeb.00535 [DOI] [PubMed] [Google Scholar]
- Higashijima S, Masino M.A, Mandel G, Fetcho J.R. Imaging neuronal activity during zebrafish behavior with a genetically encoded calcium indicator. J. Neurophysiol. 2003;90:3986–3997. doi: 10.1152/jn.00576.2003. doi:10.1152/jn.00576.2003 [DOI] [PubMed] [Google Scholar]
- Hill A.V. The heat of shortening and the dynamic constants of muscle. Proc. R. Soc. B. 1938;126:136–195. doi:10.1098/rspb.1938.0050 [Google Scholar]
- Hill A.V. The efficiency of mechanical power development during muscular shortening and its relation to load. Proc. R. Soc. B. 1964;159:319–324. doi: 10.1098/rspb.1964.0005. doi:10.1098/rspb.1964.0005 [DOI] [PubMed] [Google Scholar]
- Hirano M, Rome L.C. Jumping performance of frogs (Rana pipiens) as a function of muscle temperature. J. Exp. Biol. 1984;108:429–439. [Google Scholar]
- Johnston I.A. Dynamic properties of fish muscle. In: Webb P.W, Weihs D, editors. Fish biomechanics. Praeger; New York, NY: 1983. pp. 36–67. [Google Scholar]
- Johnson T.P, Johnston I.A. Power output of fish muscle fibres performing oscillatory work: effects of acute and seasonal temperature change. J. Exp. Biol. 1991;157:409–423. [Google Scholar]
- Johnston I.A, Lucking M. Temperature induced variation in the distribution of different types of muscle fibre in the goldfish (Carassius auratus) J. Comp. Physiol. 1978;124:111–116. [Google Scholar]
- Johnston I.A, Davison W, Goldspink G. Energy metabolism of carp swimming muscles. J. Comp. Physiol. 1977;114:203–216. [Google Scholar]
- Johnston I.A, Sidell B.D, Driedzic W. Force–velocity characteristics and metabolism of carp muscle fibres following temperature acclimation. J. Exp. Biol. 1985;119:239–249. doi: 10.1242/jeb.119.1.239. [DOI] [PubMed] [Google Scholar]
- Johnston I.A, Fleming J.D, Crockford T. Thermal acclimation and muscle contractile properties in cyprinid fish. Am. J. Physiol. 1990;259:R231–R236. doi: 10.1152/ajpregu.1990.259.2.R231. [DOI] [PubMed] [Google Scholar]
- Jones P.L, Sidell B.D. Metabolic responses of striped bass Morone saxatilis to temperature acclimation. Alterations in metabolic carbon sources and distributions of fiber types in locomotory muscle. J. Exp. Zool. 1982;219:163–171. doi:10.1002/jez.1402190205 [Google Scholar]
- Josephson R.K. Mechanical power output from striated muscle during cyclic contraction. J. Exp. Biol. 1985;114:493–512. [Google Scholar]
- Katz S.L, Syme D.A, Shadwick R.E. High-speed swimming. Enhanced power in yellowfin tuna. Nature. 2001;410:770–771. doi: 10.1038/35071170. doi:10.1038/35071170 [DOI] [PubMed] [Google Scholar]
- Liao J, Lauder G.V. Function of the heterocercal tail in white sturgeon: flow visualization during steady swimming and vertical maneuvering. J. Exp. Biol. 2000;203:3585–3594. doi: 10.1242/jeb.203.23.3585. [DOI] [PubMed] [Google Scholar]
- Liao J.C, Beal D.N, Lauder G.V, Triantafyllou M. Fish exploiting vortices decrease muscle activity. Science. 2003;302:1566–1569. doi: 10.1126/science.1088295. doi:10.1126/science.1088295 [DOI] [PubMed] [Google Scholar]
- Liu K.S, Gray M, Otto S.J, Fetcho J.R, Beattie C.E. Mutations in deadly seven/notch1a reveal developmental plasticity in the escape response circuit. J. Neurosci. 2003;23:8159–8166. doi: 10.1523/JNEUROSCI.23-22-08159.2003. [DOI] [PMC free article] [PubMed] [Google Scholar]
- Lutz G.J, Rome L.C. Muscle function during jumping in frogs. I. Sarcomere length change, EMG pattern, and jumping performance. Am. J. Physiol. (Cell Physiol.) 1996;271:C563–C570. doi: 10.1152/ajpcell.1996.271.2.C563. [DOI] [PubMed] [Google Scholar]
- Marsh R.L. Deactivation rate and shortening velocity as determinants of contractile frequency. Am. J. Physiol. 1990;259:R223–R230. doi: 10.1152/ajpregu.1990.259.2.R223. [DOI] [PubMed] [Google Scholar]
- McGlinchey S.M, Saporetti K.A, Forry J.A, Pohronezny J.A, Coughlin D.J. Red muscle function during steady swimming in brook trout, Salvelinus fontinalis. Comp. Biochem. Physiol. A Mol. Integr. Physiol. 2001;129:727–738. doi: 10.1016/s1095-6433(01)00334-8. doi:10.1016/S1095-6433(01)00334-8 [DOI] [PubMed] [Google Scholar]
- Neville W.C, Talbot G.B. The fishery for scup with special reference to fluctuations in yield and their causes. US Dept. Int. US Fish. Wildl. Serv. Spec. Sci. Rep. Fish. 1964;459:61. [Google Scholar]
- Rall J.A, Woledge R.C. Influence of temperature on mechanics and energetics of muscle contraction. Am. J. Physiol. 1990;259:R197–R203. doi: 10.1152/ajpregu.1990.259.2.R197. [DOI] [PubMed] [Google Scholar]
- Ritter D.A, Bhatt D.H, Fetcho J.R. In vivo imaging of zebrafish reveals differences in the spinal networks for escape and swimming movements. J. Neurosci. 2001;21:8956–8965. doi: 10.1523/JNEUROSCI.21-22-08956.2001. [DOI] [PMC free article] [PubMed] [Google Scholar]
- Rome L.C. The energetic cost of running with different muscle temperatures in savannah monitor lizards. J. Exp. Biol. 1982;97:411–426. [Google Scholar]
- Rome L.C. The influence of temperature on muscle recruitment and function in vivo. Am. J. Physiol. 1990;259:R210–R222. doi: 10.1152/ajpregu.1990.259.2.R210. [DOI] [PubMed] [Google Scholar]
- Rome L.C, Swank D. The influence of temperature on power output of scup red muscle during cyclical length changes. J. Exp. Biol. 1992;171:261–281. doi: 10.1242/jeb.171.1.261. [DOI] [PubMed] [Google Scholar]
- Rome L.C, Swank D. The Influence of thermal acclimation on power production during swimming. I. In vivo stimulation and length change pattern of scup red muscle. J. Exp. Biol. 2001;204:409–418. doi: 10.1242/jeb.204.3.409. [DOI] [PubMed] [Google Scholar]
- Rome L.C, Loughna P.T, Goldspink G. Muscle fiber recruitment as a function of swim speed and muscle temperature in carp. Am. J. Physiol. 1984;247:r272–r279. doi: 10.1152/ajpregu.1984.247.2.R272. [DOI] [PubMed] [Google Scholar]
- Rome L.C, Loughna P.T, Goldspink G. Temperature acclimation improves sustained swimming performance at low temperatures in carp. Science. 1985;228:194–196. doi: 10.1126/science.228.4696.194. doi:10.1126/science.228.4696.194 [DOI] [PubMed] [Google Scholar]
- Rome L.C, Funke R.P, Alexander R.M, Lutz G, Aldridge H, Scott F, Freadman M. Why animals have different muscle fibre types. Nature. 1988;355:824–827. doi: 10.1038/335824a0. doi:10.1038/335824a0 [DOI] [PubMed] [Google Scholar]
- Rome L.C, Funke R.P, Alexander R.M. The influence of temperature on muscle velocity and sustained performance in swimming carp. J. Exp. Biol. 1990;154:163–178. doi: 10.1242/jeb.154.1.163. [DOI] [PubMed] [Google Scholar]
- Rome L.C, et al. The influence of temperature on muscle function in fast swimming scup. I. Shortening velocity and muscle recruitment during swimming. J. Exp. Biol. 1992a;163:259–279. doi: 10.1242/jeb.163.1.259. [DOI] [PubMed] [Google Scholar]
- Rome L.C, Sosnicki A.A, Choi I. The influence of temperature on muscle function in the fast swimming scup. II. The mechanics of red muscle. J. Exp. Biol. 1992b;163:281–295. doi: 10.1242/jeb.163.1.281. [DOI] [PubMed] [Google Scholar]
- Rome L.C, Swank D, Corda D. How fish power swimming. Science. 1993;261:340–343. doi: 10.1126/science.8332898. doi:10.1126/science.8332898 [DOI] [PubMed] [Google Scholar]
- Rome L.C, Syme D.A, Hollingsworth S, Lindstedt S.L, Baylor S.M. The whistle and the rattle: the design of sound-producing muscles. Proc. Natl Acad. Sci. USA. 1996;93:8095–8100. doi: 10.1073/pnas.93.15.8095. doi:10.1073/pnas.93.15.8095 [DOI] [PMC free article] [PubMed] [Google Scholar]
- Rome L.C, Swank D, Coughlin D.J. The influence of temperature on power production during swimming. II. Mechanics of red muscle fibres in vivo. J. Exp. Biol. 2000;203:333–345. doi: 10.1242/jeb.203.2.333. [DOI] [PubMed] [Google Scholar]
- Sidell B.D. Responses of goldfish (Carassius auratus, L.) muscle to acclimation temperature: alterations in biochemistry and proportions of different fiber types. Physiol. Zool. 1980;53:98–107. [Google Scholar]
- Sisson J.E, Sidell B.D. Effect of thermal acclimation on muscle fiber recruitment of swimming striped bass (Morone saxatilis) Physiol. Zool. 1987;60:310–320. [Google Scholar]
- Swank D, Rome L.C. The influence of temperature on power production during swimming. I. In vivo length change and stimulation pattern. J. Exp. Biol. 2000;203:321–333. doi: 10.1242/jeb.203.2.321. [DOI] [PubMed] [Google Scholar]
- Swank D, Rome L.C. The influence of thermal acclimation on power production during swimming. II. In vivo mechanics of scup red muscle. J. Exp. Biol. 2001;204:419–430. doi: 10.1242/jeb.204.3.419. [DOI] [PubMed] [Google Scholar]
- Swank D, Zhang G, Rome L.C. Contraction kinetics of red muscle in scup: mechanism for variation in relaxation rate. J. Exp. Biol. 1997;200:1297–1307. doi: 10.1242/jeb.200.9.1297. [DOI] [PubMed] [Google Scholar]
- Syme D.A, Shadwick R.E. Effects of longitudinal body position and swimming speed on mechanical power of deep red muscle from skipjack tuna (Katsuwonus pelamis) J. Exp. Biol. 2002;205:189–200. doi: 10.1242/jeb.205.2.189. [DOI] [PubMed] [Google Scholar]
- Thys T.M, Blank J.M, Coughlin D.J, Schachat F. Longitudinal variation in muscle protein expression and contraction kinetics of largemouth bass axial muscle. J. Exp. Biol. 2001;204:4249–4257. doi: 10.1242/jeb.204.24.4249. [DOI] [PubMed] [Google Scholar]
- Wardle C.S, Videler J.J, Altringham J.D. Tuning in to fish swimming waves: body form, swimming mode and muscle function. J. Exp. Biol. 1995;198:1629–1636. doi: 10.1242/jeb.198.8.1629. [DOI] [PubMed] [Google Scholar]
- Webb P.W. Hydrodynamics: non-scombroid fish. In: Hoar W.S, Randall D.J, editors. Fish physiology. vol. 7. Academic Press; New York, NY: 1978. pp. 189–237. [Google Scholar]
- Wolfgang M.J, Anderson J.M, Grosenbaugh M, Yue D, Triantafyllou M. Near-body flow dynamics in swimming fish. J. Exp. Biol. 1999;202:2303–2327. doi: 10.1242/jeb.202.17.2303. [DOI] [PubMed] [Google Scholar]
- Zhang G, Swank D, Rome L.C. Quantitative distribution of muscle fiber types in the scup. J. Morphol. 1996;29:71–81. doi: 10.1002/(SICI)1097-4687(199607)229:1<71::AID-JMOR4>3.0.CO;2-S. doi:10.1002/(SICI)1097-4687(199607)229:1<71::AID-JMOR4>3.0.CO;2-S [DOI] [PubMed] [Google Scholar]


