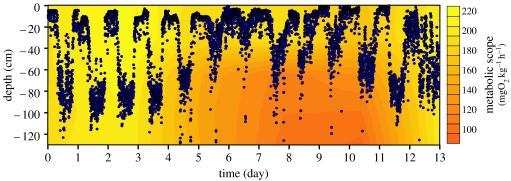
Figure 5.
Linking sea bass distribution pattern to its associated scope for activity (recalculated from fig. 5 in Schurmann et al. (1998)). The spatially explicit colour-coded background represents sea bass metabolic scope calculated by entering the prevailing temperature and oxygenation conditions in the model of Claireaux & Lagardère (1999). In this experiment, temperature ranged between 11 and 22°C and water oxygenation between 3 and 6 mg l−1. Fish vertical position (accuracy±10 cm) was obtained using acoustic telemetry tags and receiver (Vemco, Shad-Bay, Canada).

