Figure 4.
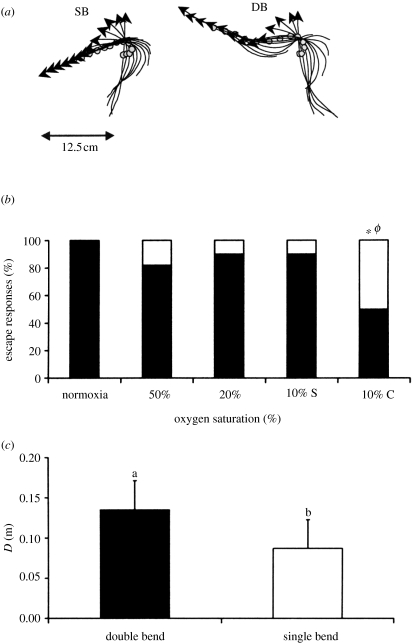
Golden grey mullet (a) examples of tracings of a single bend (SB) and a double bend (DB) response, performed in hypoxia and normoxia, respectively. Midline and centre of mass (open circle) of the fish are shown at 10 ms intervals from the frame preceding the onset of the response. Arrows indicate the head. While the DB response shows a reversal in the direction of turning of the head (at frame six) and the fish return flip is complete, in SB the fish goes into a glide after frame six. (b) Percentage of DB responses (black bars) out of the total in normoxia and various hypoxic conditions. Ten per cent C indicates no access to the surface at 10% oxygen saturation. Asterisk indicates a significant difference from normoxia. ϕ indicates a significant difference between 10% S and 10% C. (c) The locomotor performance of SB and DB responses (D, distance covered in 80 ms). Values not sharing a common subscripts are significantly different. From Lefrançois et al. (2005).

