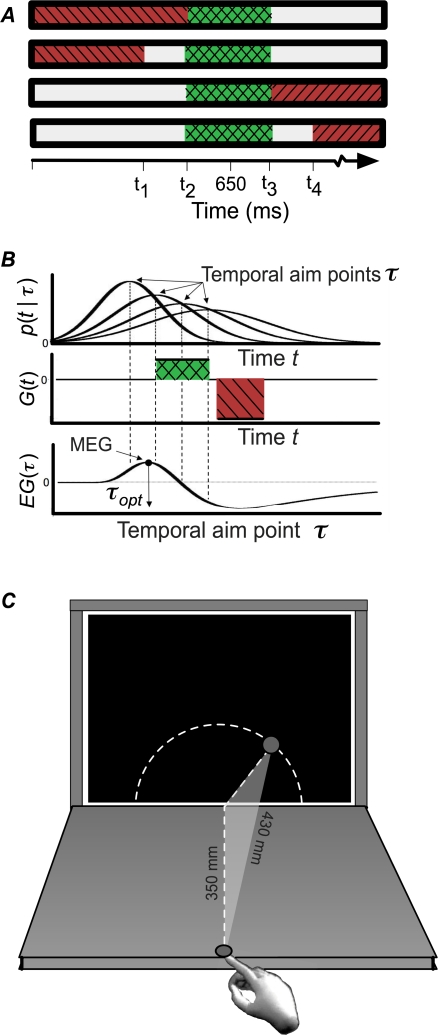
Figure 1. Reward/Penalty Configurations and Expected Gain.
(A) Four reward/penalty configurations. The horizontal axis represents time (ms) and the color of each interval specified the reward the subject received if the reach time fell within that interval. Intervals that incurred penalties (−36 points) were coded red (also striped in the figure), those that earned reward (+12 points), green (also cross-hatched). The choice of times t 1,…,t 4 that defined the reward and penalty regions was defined based on each subject's movement duration variance (for a target duration of 650 ms) to equate task difficulty. (B) Expected gain calculation. Upper Panel: The Gaussian distribution of actual movement durations t for four choices of planned movement durations τ. The vertical dashed lines mark four possible planned movement durations. Standard deviations σ(τ) increase linearly with planned duration. Middle Panel: The gain G(t) associated with each actual movement duration t. Lower Panel: Expected gain EG(t) as a function of planned movement duration τ. Expected gain is determined by the probability that the actual movement duration falls into the reward or penalty regions. The maximum expected gain (MEG) and the corresponding planned movement duration τopt are indicated. (C) Schematic diagram showing the geometric relationship between the start position of the reach and the circular arc along which spatial reach targets were drawn. Reach distance was always 430 mm, regardless of the position of the target along the arc.

