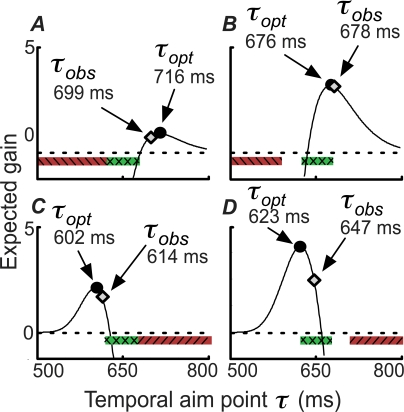
Figure 4. Expected Gain as a Function of Planned Movement Duration for One Subject (HT).
The expected gain EG(τ) for each possible planned movement duration is shown as a solid line. MEG points are marked as circles and observed mean durations are marked as diamonds. The four panels A–D correspond to the four conditions in Figure 1A. Reward and penalty regions are coded as in Figure 1A.

