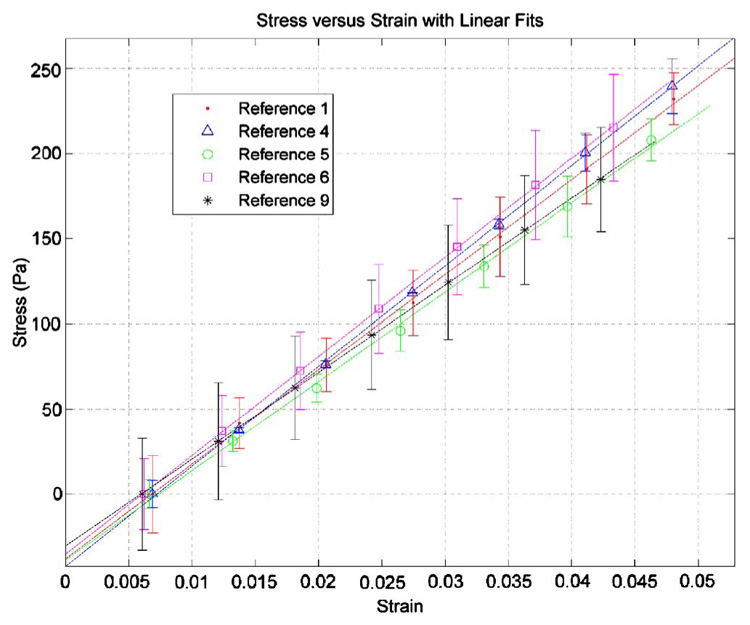
Fig. 6.

Stress-strain curves for a sampling of the reference gels from compression testing. A precompression from 3% to 5% strain (0.3 mm) was applied prior to testing. The values are average values for the two compression tests performed on each gel, with error bars indicating the standard deviation of the stress values from two tests.
