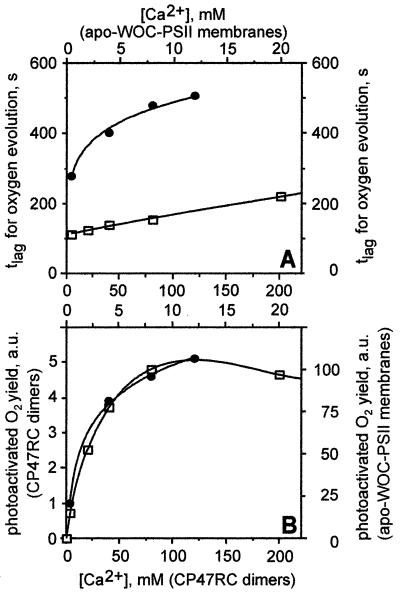
Figure 3.
Dependence of the tlag for photoactivation (A) and maximal oxygen yield (B) of activated centers of CP47RC dimers (●) and apo-WOC-PSII membranes (□) on CaCl2 concentration. For CP47RC dimers, measurements were conducted on samples in buffer containing 40 μM MnCl2, protein equivalent to 10 μM RCs, and 0.8 mM ferricyanide. Light conditions are as shown in Fig. 2. The tlag was estimated by using data from the first illumination cycle (see Fig. 2A), whereas the maximal oxygen evolution refers to the maximal yield at the end of a second illumination cycle. Data for apo-WOC-PSII membranes were taken from ref. 22.

