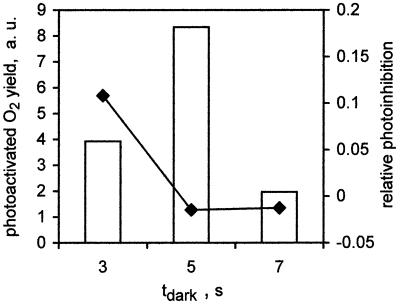
Figure 5.
Maximal oxygen evolution rate of photoactivated CP47RC dimers (bars) and relative photoinhibition (♦) vs. dark time between the flashes. Reaction mixture contained 40 μM MnCl2, 80 mM CaCl2, protein equivalent to 10 μM RCs, and 0.8 mM ferricyanide. Photoinhibition was calculated as the relative loss of maximal oxygen evolution on the final flash of 405 ms of a third cycle of illumination with the yield on the last flash of the second cycle (both cycles measured under conditions identical with those of Fig. 2A, trace II).

