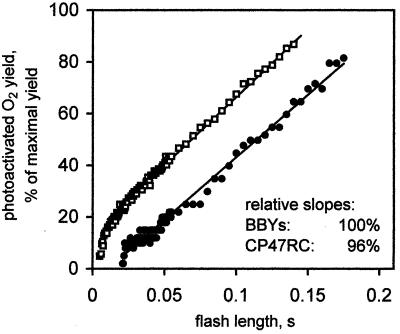
Figure 6.
Initial slopes of the oxygen yield vs. light-dose curves for PSII-enriched membranes (□) and CP47RC dimers (●). Experiments were carried out as in Fig. 2, except that for the CP47RC dimers, a tdark of 5 s was used. Samples were photoactivated in a first cycle of illumination, and the values plotted reflect the oxygen evolution yields during a second cycle. To account for the fact that only part of the CP47RC dimers could be photoactivated, the values were normalized to the maximal oxygen yield of the samples measured in continuous light. Because of the differences in absorption cross-sections, the data were standardized further to identical antenna size. Inset gives the values for the slopes calculated by linear regression.

