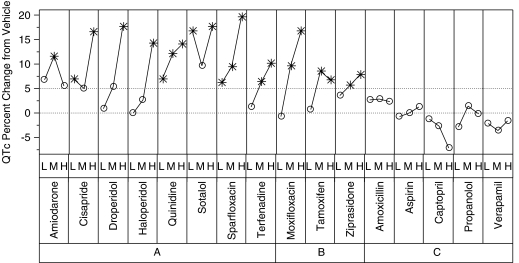
Figure 4.
Summary of QTc (heart rate corrected QT interval of the ECG) expressed as differences from vehicle. The y axis shows the mean difference from vehicle (of baseline-corrected QTc) for each drug and the low (L), medium (M) and high (H) doses (Table 3) that were tested in the anaesthetized guinea-pig model. QTc values that are significantly higher than vehicle (P<0.05) are indicated by asterisks. Every drug in groups A and B showed at least one significant increase over vehicle, but none of the drugs in group C had any significant increases over vehicle.

