
Fig. 3.
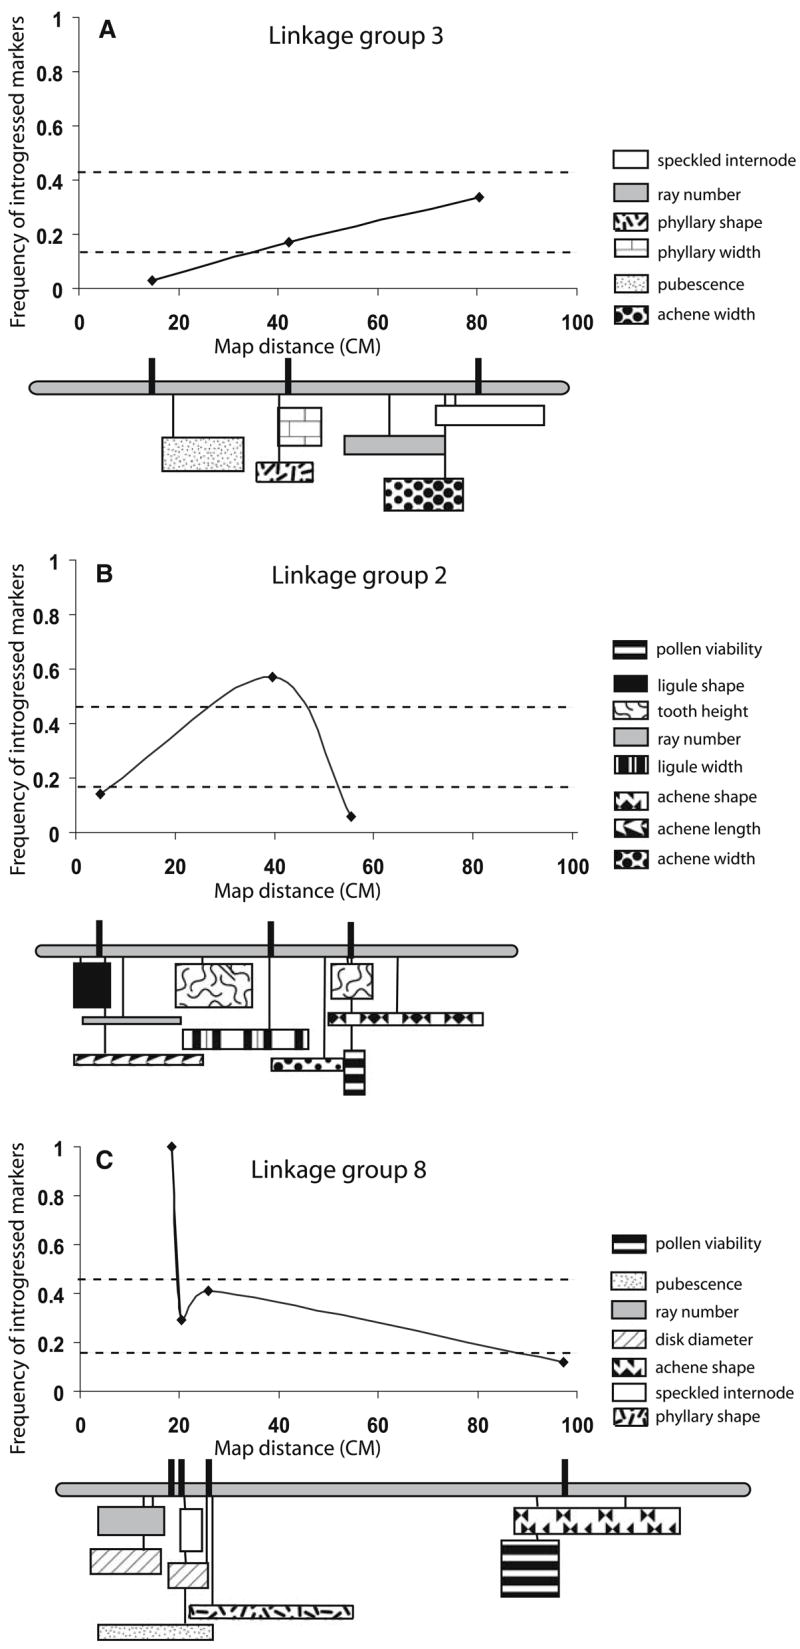
Frequency of introgressed H. debilis alleles plotted against map distance. Dashed line represents 95% confidence intervals. Linkage groups (from Kim and Rieseberg 1999) are drawn to scale below each graph. Markers surveyed are indicated with black hash marks on linkage groups. QTL positions (with one LOD support limits) and their magnitudes (indicated by height) are diagrammed below linkage groups