
Figure 2.
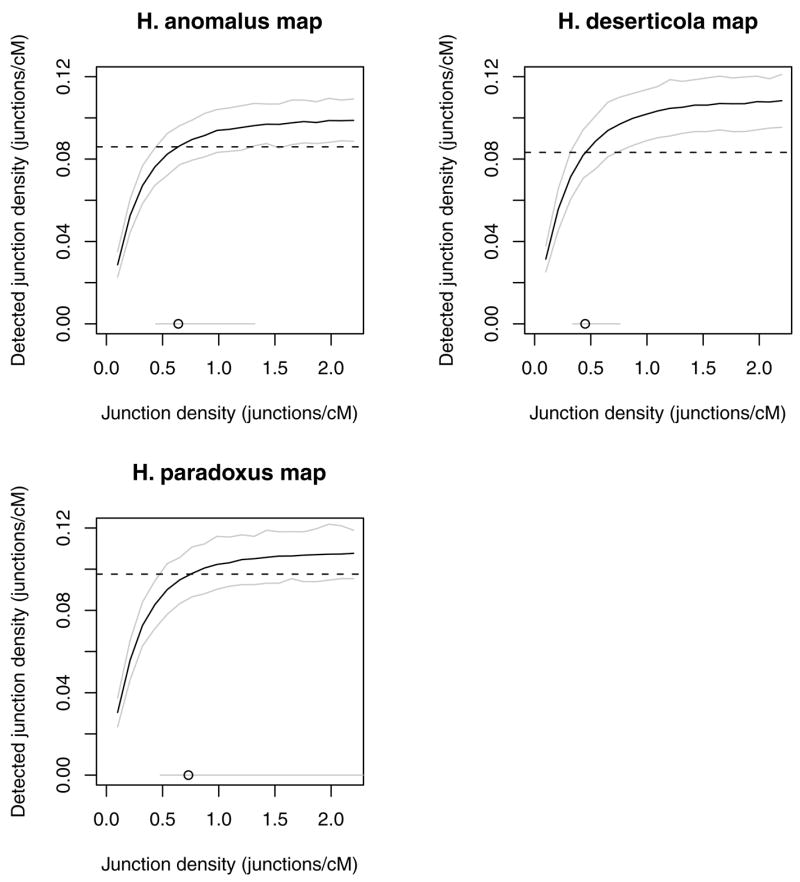
Simulations quantify how the distribution and density of informative markers on the species’ maps limit the detection of underlying junctions. The median detected density increases with simulated junction densities (0.1–2.2 junctions/cM), but saturates (black line, 95% confidence interval—gray lines). The intersection of these curves with the junction density observed on the maps of the hybrid species (dashed line), gives rise to a point estimate and confidence interval for the underlying junction density (circle and gray line at bottom).