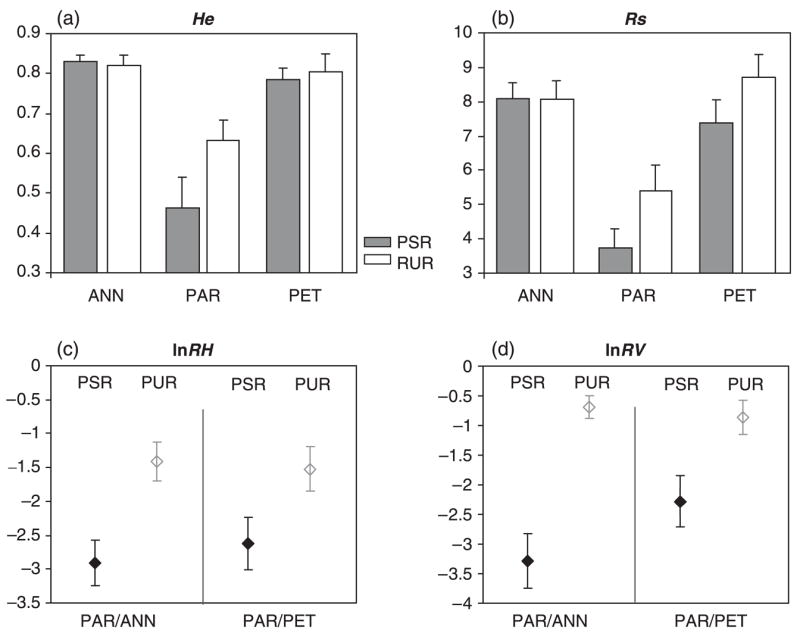
Fig. 2.

Comparison of variability levels (means and standard errors) between microsatellites in PSRs (grey) and in PURs (white). (a) gene diversity, He; (b) allelic richness, Rs; (c), lnRH of Helianthus paradoxus over Helianthus annuus and over Helianthus petiolaris, respectively; (d) lnRV of H. paradoxus over each one of its parents. Note that standard errors do not take into account population effects and therefore cannot be used to test for differences between microsatellite classes in H. paradoxus.
