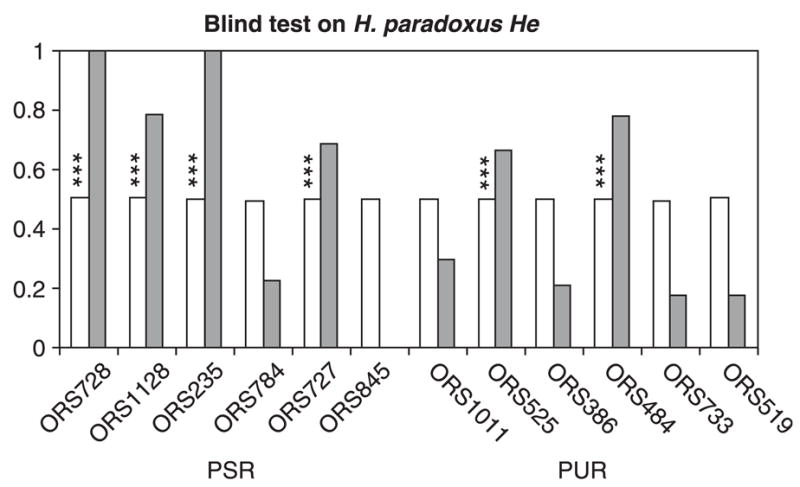
Fig. 3.

Results of a blind-test performed on the genetic diversity estimator (He) in Helianthus paradoxus. For each microsatellite, the frequency of the marker in the class with the lower diversity is in white. The difference between classes for the level of genetic diversity was assessed by the summary statistic S, and S0.05 was computed as the threshold value for rejecting the null hypothesis of no diversity differences between classes at the probability level α = 0.05. The frequency at which S exceeds S0.05 is in grey, stars indicate when S exceeds S0.001.
