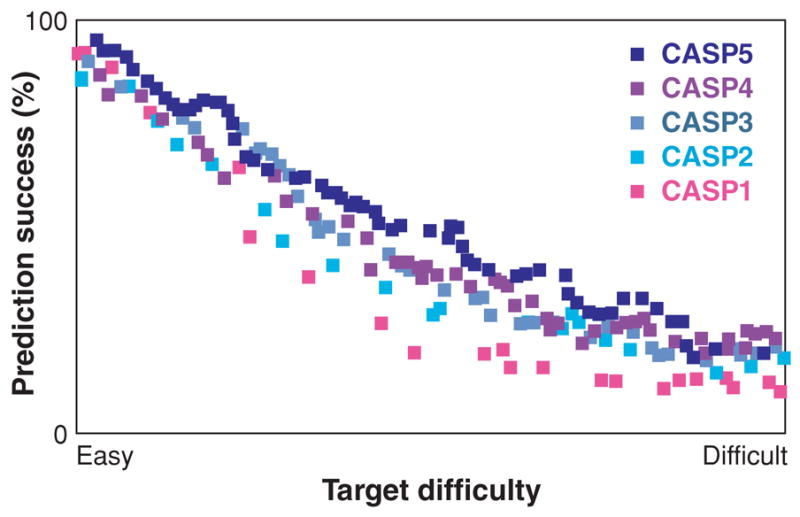
Figure 3.

Progress in protein structure prediction in CASP1–5 (219). The y-axis contains the GDT TS score, the percentage of model residues that can be superimposed on the true native structure, averaged over four resolutions from 1 to 8 Å (100% is perfect). The x-axis is the ranked target difficulty, measured by sequence and structural similarities to proteins in the PDB at the time of the respective CASP. This shows that protein structure prediction on easy targets is quite good and is improving for targets of intermediate difficulty. Reprinted from Reference 219 with permission.
