
Figure 7.
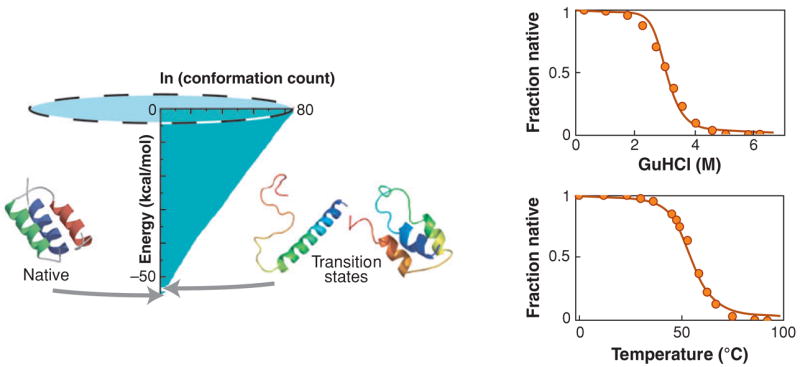
(Left) The density of states (DOS) cartoonized as an energy landscape for the three-helix bundle protein F13W*: DOS (x-axis) versus the energy (y-axis). (Right) Denaturation predictions versus experiments (146). The peak free energy (here, where the DOS is minimum), typically taken to be the transition state, is energetically very close to native.