
Figure 1.
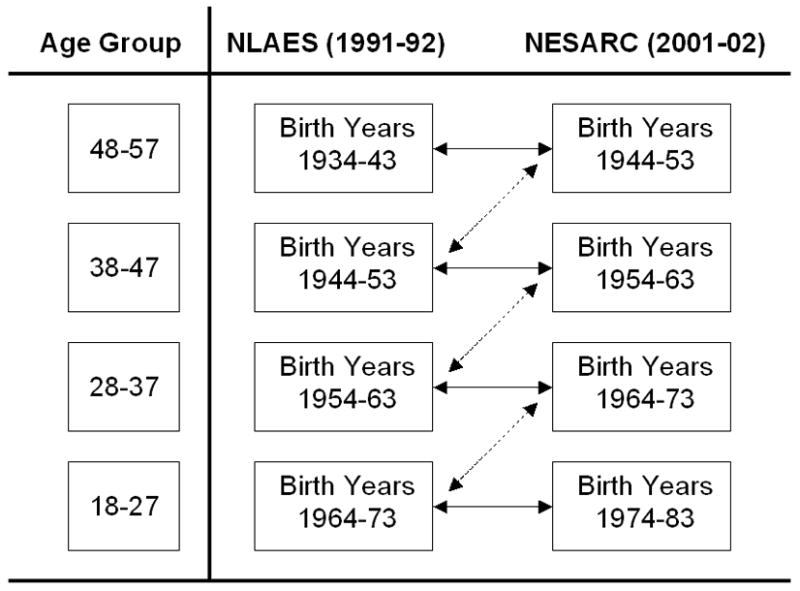
Schematic illustration of cross-survey comparisons. Dashed line corresponds to comparisons of the same birth cohort at different ages (Intra-cohort comparisons, Table 1), which assesses the magnitude of age-related effects on reported prevalence. Solid lines correspond to age-matched comparisons of temporally adjacent birth cohorts (Cross-cohort comparisons, Tables 2 and 3), which are used to provide data on differences in lifetime prevalence between birth cohorts, while controlling for the effects of age by comparing similarly aged cohorts.