
Figure 5.
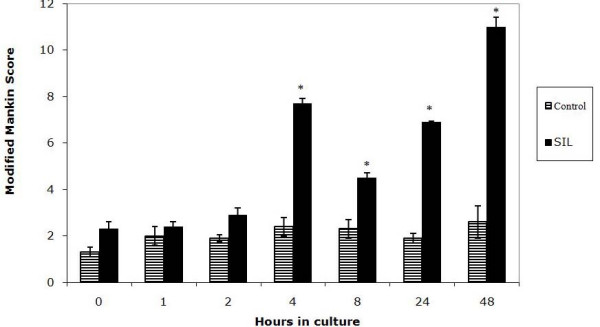
Graph to show the numbers of chondrocyte clusters in control and single impact loaded (200 g from 8 cm) cartilage over a 48 hour time period. There is a significant difference between control and single impact loaded cartilage at t= 4, 8, 24 and 48 hours in culture (*).