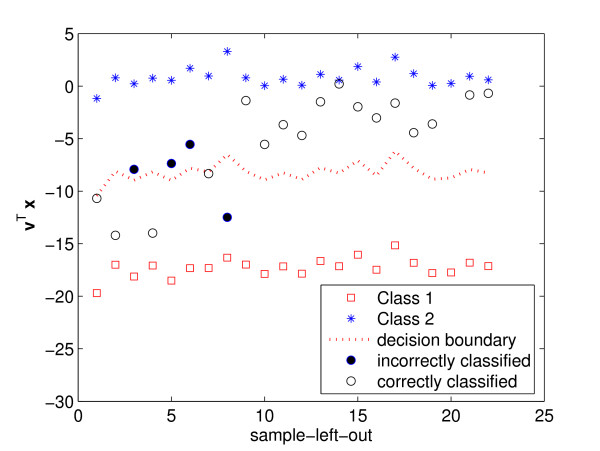
Figure 1.
Plotted here is an illustration of the over-fitting problem. The x-axis indicates the index of the sample left out for testing. In all cases, the training samples are perfectly separated (i.e., all the samples from class 1 and class 2 are projected onto two clearly distinct points – shown as * and □, respectively). The test samples fall in the middle and are not always correctly classified.

