
Figure 2.
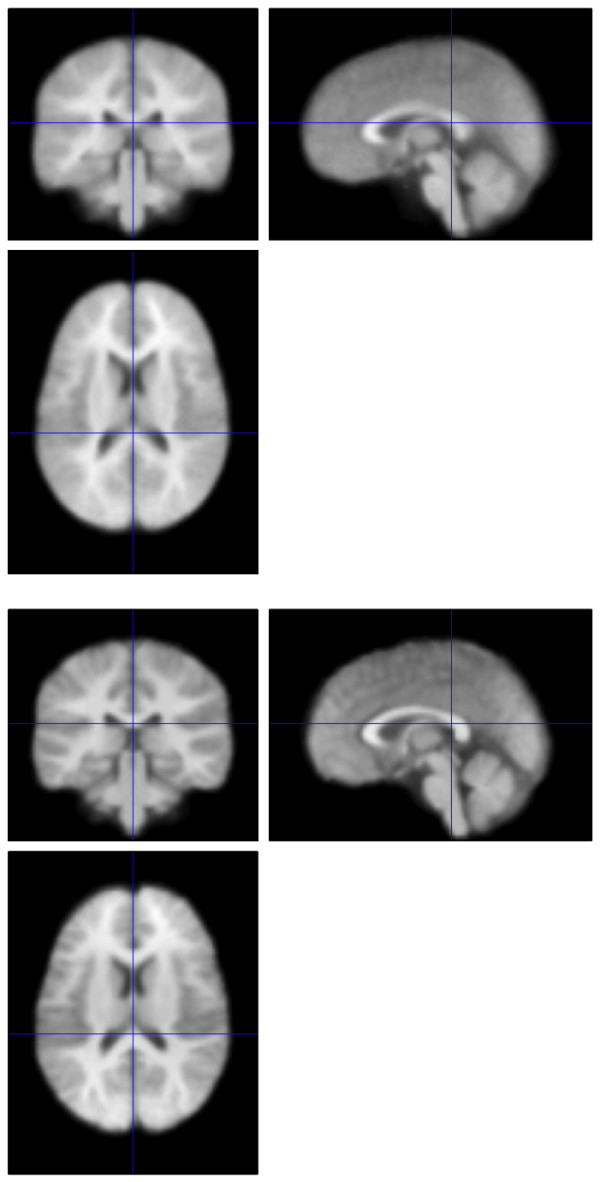
Comparison of the population template of all 36 children in the current study resulting from SPM5 (top) and the high dimensional methods utilized in the present study (bottom).
Official websites use .gov
A
.gov website belongs to an official
government organization in the United States.
Secure .gov websites use HTTPS
A lock (
) or https:// means you've safely
connected to the .gov website. Share sensitive
information only on official, secure websites.
Comparison of the population template of all 36 children in the current study resulting from SPM5 (top) and the high dimensional methods utilized in the present study (bottom).