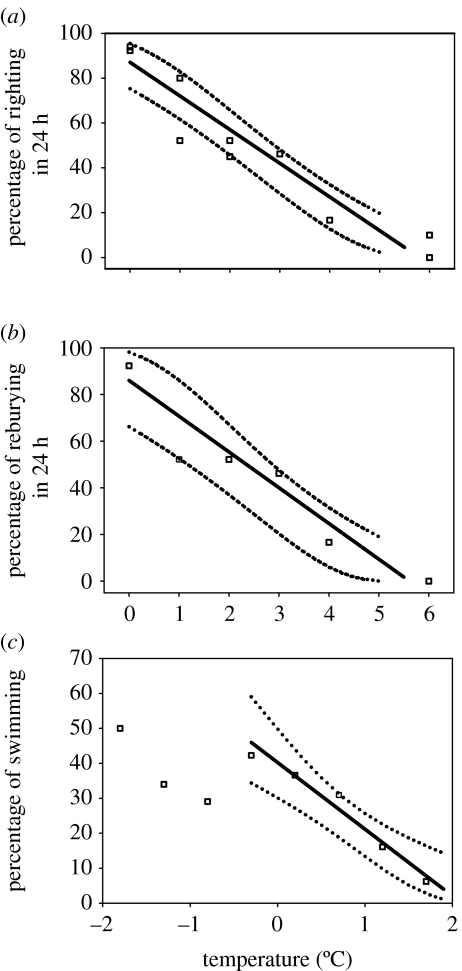
Figure 4.
(a) Righting responses in the Antarctic limpet, N. concinna, with temperature. Data shown are the proportion of limpets righting in 24 h. For each point, n=20–31. All regressions were made following square root and arcsin transforms of percentage data (arcsin(√%righting) =1.20 −0.180T°C; r2=0.90, F=77.9, p<0.001, d.f.=9). (b) Reburying in the bivalve mollusc, L. elliptica, with temperature. Data show the proportion of animals reburying in 24 h (n=18–26 for each point). Regression line: arcsin(√%burying) =0.95−0.173T°C (r2=0.85, F=22.4, p=0.009, d.f.=5). (c) The proportion of Antarctic scallops, A. colbecki, swimming in response to freshwater stimulation. Each point is the proportion swimming at that temperature (n=57–175 for each point). A regression was fitted to data for temperatures above −0.3°C, where a clear temperature effect was apparent. This regression was fitted to square root- and arcsin-transformed percentage values. Regression line: arcsin(√%swimming) =0.682–0.230T°C (r2=0.93, F=51.5, p=0.006, d.f.=4). In all figures, dotted lines indicate 95% CIs for regressions. For all plots, lines and CIs shown were plotted following sine and square back transforms. (figure modified from Peck et al. 2004b.)

