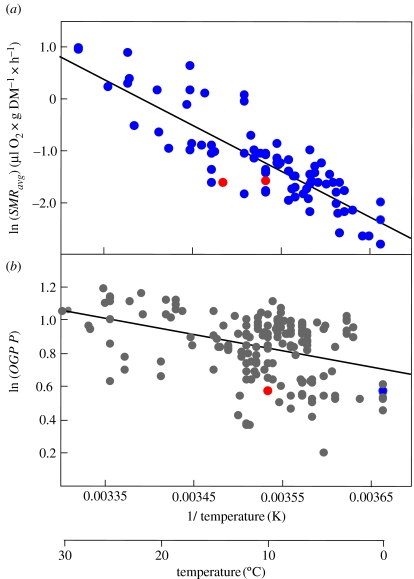
Figure 7.
Arrhenius plots for the comparison of (a) average standard metabolic rates (SMR; (lnSMRavg)=30.116–8874.24 1/T, 82 measurements, 13 species, r2=0.725, p<0.001, Q10=2.28) with their annual rates of growth defined by (b) the overall growth performance (P, ln(OGP P) =4.22–958.466 1/T, 198 studies, 25 species, r2=0.132, p<0.001, Q10=1.12) in pectinid species from various temperature regimes (modified after Heilmayer et al. 2004). Note that growth rates in polar species (on the right) result higher than expected parallel decrease in SMR with temperature, thereby indicating high growth efficiency.

