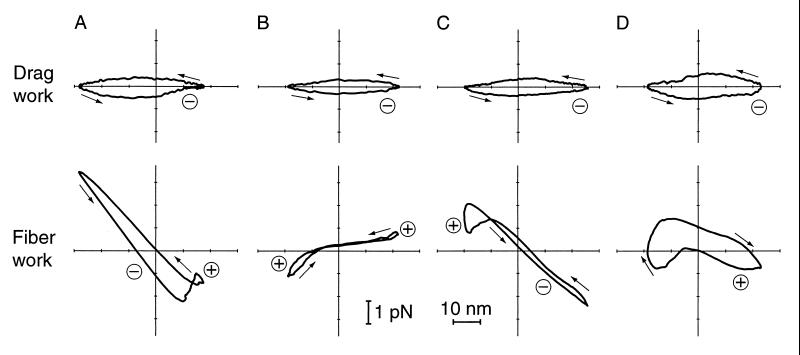
Figure 3.
The force exerted on the hair bundle by viscous drag, FD (Upper), or by the stimulus fiber, FSF (Lower), versus the fiber’s tip motion, X. Because the hair bundle’s movement was periodic, these graphs are closed. The areas enclosed by the curves give respectively the average energy dissipated by viscous drag,  D, and the average work provided by the stimulus fiber,
  SF, during one period. The arrows indicate the direction of circulation around a cycle: clockwise circulation signals positive work that powered the hair bundle, whereas motion in the opposite direction reflects negative work that withdrew energy from the bundle. (A) The hair bundle analyzed in Fig. 2 was deflected with a ±10-nm stimulus at a frequency of 9 Hz, lower than the hair bundle’s characteristic frequency of 14 Hz. Here
  D = −39 zJ,
  SF = −40 zJ, and thus
  A = +79 zJ. (B) Another hair bundle was driven with a ±30-nm deflection at a frequency of 8 Hz, near the characteristic frequency of 8.5 Hz. In this instance
  D = −37 zJ,
  SF = +3 zJ, and therefore
  A = +34 zJ. (C) A third bundle received a ±13-nm deflection at 7 Hz, a frequency just below its characteristic frequency of 8 Hz. Here
  D = −42 zJ,
  SF = −6 zJ, and thus
  A = +48 zJ. (D) After the same cell had fatigued during protracted stimulation, a record was obtained with ±18-nm stimulation at 13 Hz, a frequency lower than the characteristic frequency of 16 Hz. As a consequence of the declining active process,
  D = −49 zJ,
  SF = +50 zJ, and consequently
  A = −1 zJ.

