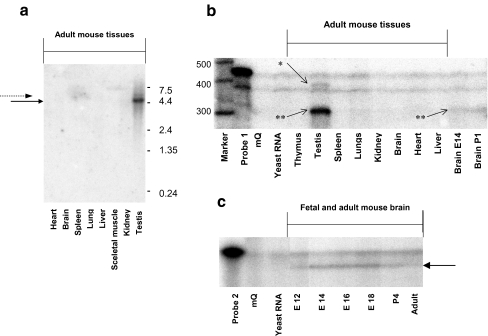
Fig. 2.
The mFu expression in mouse tissues. a Northern blot analysis of mFu expression in eight different tissues as indicated. The major 5 kb band is indicated with a solid arrow and the minor 5.5 kb band with a dotted arrow. b RPA expression analysis of Fu(Δ6–26) (*) and FuFL (**) using probe 1 in eight adult tissues and two stages of brain development. c RPA analysis of mouse brain at different developmental stages as indicated (Fused protection indicated by arrow). b and c Pure water (mQ) and yeast RNA are used as negative controls

