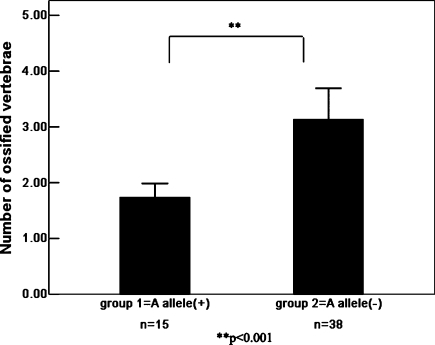
Fig. 4.
The number of ossified vertebrae of OPLL patients in each subgroup classified by genotype of the Ser87Ser (A/G). Data are expressed as means (bars) ± SEM (error bars). The number of patients is shown under each bar. The difference in the number of ossified vertebrae between carriers (group 1) and noncarriers (group 2) of deletion A allele was statistically analyzed. ** P < 0.001

