
Figure 1.
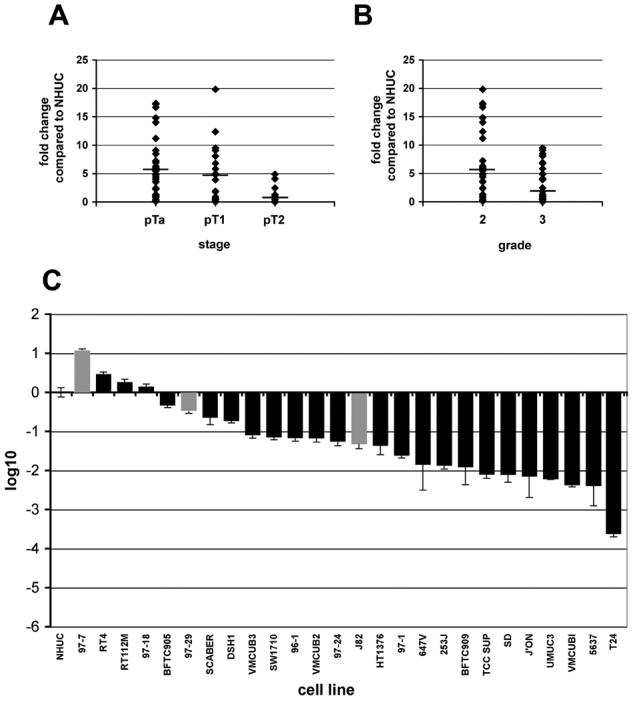
Expression levels of FGFR3 in bladder tumours and bladder cancer cell lines. FGFR3 transcript levels were measured by real-time RT-PCR and normalised to SDHA. Values represent fold difference compared to FGFR3 transcript levels in NHUC. A, FGFR3 transcript levels were measured in 34 pTa, 19 pT1 and 12 pT2 bladder tumours. B, the tumours were separated according to grade; 31 grade 2 and 33 grade 3. Only one grade 1 tumour was harvested and therefore not included in the graph. C, FGFR3 transcript levels were measured in 26 bladder cancer cell lines and the fold change was represented using log10. The bars for bladder cancer cell lines containing FGFR3 mutations are shown in grey.