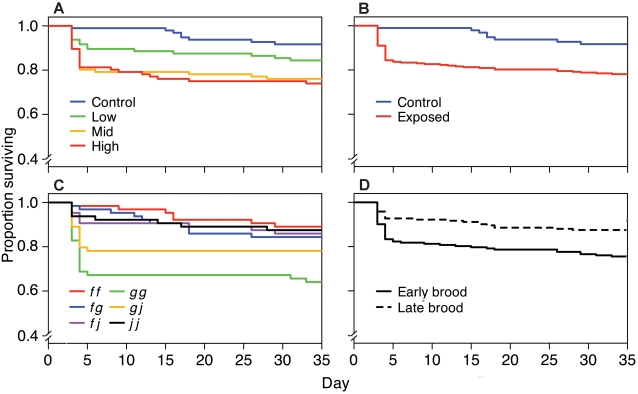
Figure 2. Survival with time as a function of bacterial dose, MHC genotype, and clutch order among families.
Kaplan-Meier plots showing the survival of (A) tadpoles exposed to the control (3.0×10⁶ cfu/ml heat-killed), low (1.0×10⁶ cfu/ml), medium (2.5×10⁶ cfu/ml), and high (3.0×10⁶ cfu/ml) doses of A. hydrophila; (B) tadpoles exposed to the control or A. hydrophila (all doses combined); (C) tadpoles from each MHC genotype; and (D) tadpoles from early and late clutches.

