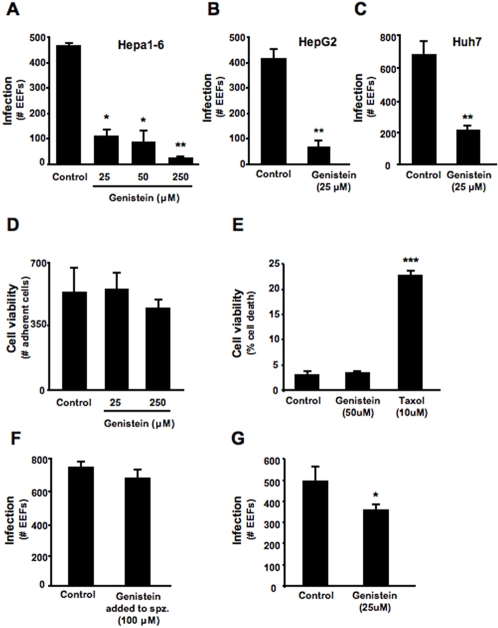
Figure 1. Genistein inhibits in vitro hepatoma cell infection by Plasmodium sporozoites.
Cultured Hepa1-6 cells were incubated with increasing doses of genistein (A) and cultured HepG2 and Huh7 cells were incubated with 25 μM of genistein (B) and (C). As control, cells were treated with equivalent volumes of DMSO as in the genistein treated groups. The number of infected cells was determined 24 hours after infection with 4×10⁴ P. berghei ANKA sporozoites and is shown as the total number of EEFs in each coverslip. Each condition was assayed in duplicate in (A) or triplicate in (B) and (C). ★ p<0.05, ★★ p<0.01 (TTest relative to control group). Bar plot shows one representative of 3 independent experiments, error bars represent s.d. of mean number of EEFs in each condition. (D) Cultured HepG2 cells were incubated with different concentrations of genistein, or DMSO (control). After 24 hours the number of adherent cells in 10 microscope fields representing approximately 20% of the total area was assessed at 400× magnification. Each condition was assayed in duplicate. (E) Cultured Huh7 were incubated with Genstein or Taxol, along with their respective controls of DMSO, and allowed to grow for 24 hours. After this time both adherent and non-adherent cells were collected and incubated with propidium iodide. Percentage of death cells was quantified by flow cytometry. Bar plot shows one representative of 3 independent experiments, error bars represent s.d. of mean cell death percentage in each condition (n = 3). ★★ p<0.01 (TTest relative to control group). (F) P. berghei ANKA sporozoites were incubated with 100 μM genistein or DMSO for 30 min. Sporozoites were washed with PBS to remove genistein and used to infect cultured HepG2 cells. Infection was determined 24 hours post-infection by counting the total number of EEFs in each coverslip. Each experimental condition was assayed in triplicate. Bar plot shows one representative of 3 independent experiments. Error bars represent s.d. of mean number of EEFs in each condition (n = 3). (G) Huh7 cells were incubated with 25 μM genistein or DMSO for 2 h. Cells were then washed with PBS and fresh medium to remove genistein. P. berghei sporozoites were then added to these cells. Infection was determined 24 hours post-infection by counting the total number of EEFs in each coverslip. Each experimental condition was assayed in triplicate. Bar plot shows one representative of 3 independent experiments. Error bars represent s.d. of mean number of EEFs in each condition (n = 3).

