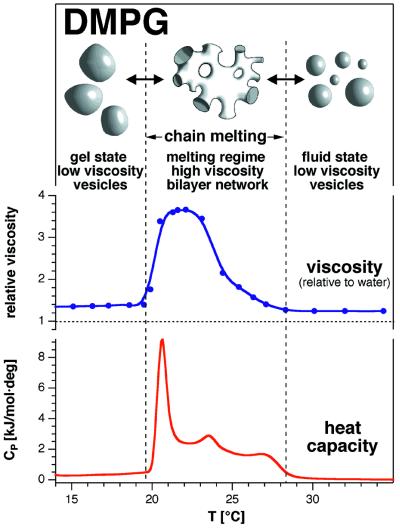
Figure 1.
Schematic summary of the chain of events deduced from calorimetry, viscosity measurements, and electron microscopy (see Figs. 2 and 3). Structural changes represent changes in the three-dimensional membrane arrangement. These changes correlate with viscosity increases and distinct heat capacity maxima. Viscosities are given relative to those of water at the same temperature.

