
Figure 5.
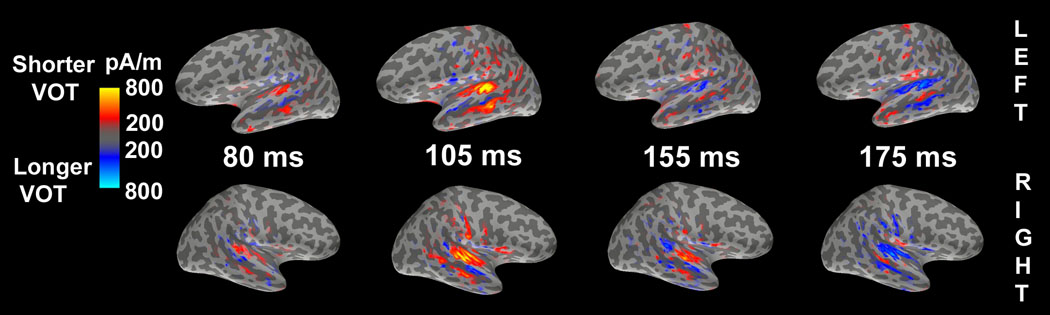
Functional contrast maps for VOT. The maps indicate differences in the activation related to the different VOT sectors. Red and blue represents greater activation for syllables with shorter and longer VOT, respectively.
Official websites use .gov
A
.gov website belongs to an official
government organization in the United States.
Secure .gov websites use HTTPS
A lock (
) or https:// means you've safely
connected to the .gov website. Share sensitive
information only on official, secure websites.
Functional contrast maps for VOT. The maps indicate differences in the activation related to the different VOT sectors. Red and blue represents greater activation for syllables with shorter and longer VOT, respectively.