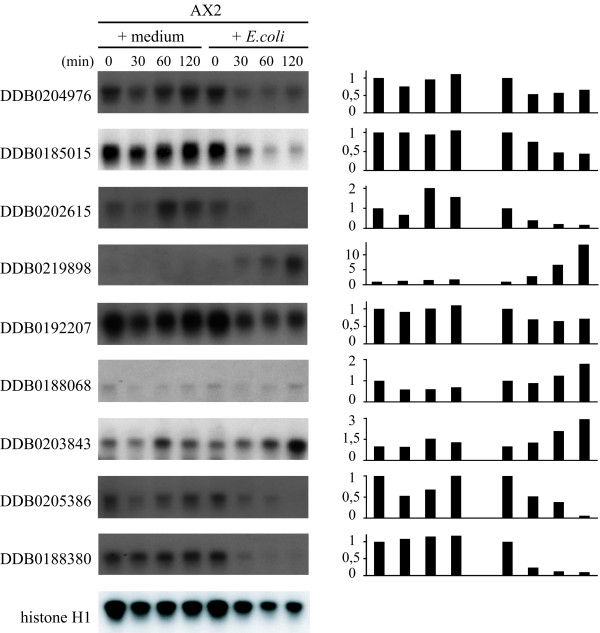
Figure 1.
Time course of gene expression in cells incubated in axenic medium or with E. coli. Exponentially growing AX2 cells were washed from axenic medium, resuspended at a concentration of 5 × 10⁶ per ml and incubated either in axenic medium or with a 1000-fold excess of E. coli B/r in Soerensen phosphate buffer. At the time indicated, cells were washed and the RNA extracted with TRIzol as described in Methods. After agarose electrophoresis, the Northern blots were hybridized with the DNA probes indicated on the left. (Right) The intensity of the bands in Northern blots was calculated using ImageJ and normalized to the value of the histone H1 gene as internal control. The normalized values at each time point were divided for the values at time 0 and expressed as fold increase or decrease, setting the 0-point to 1.

