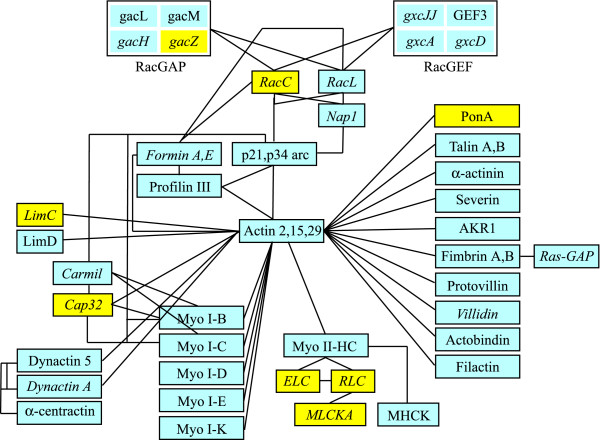
Figure 10.
Regulation of genes encoding actin cytoskeleton proteins by phagocytosis and growth on bacteria. The figure shows the protein products of genes for actin cytoskeletal proteins and their small G protein regulators, which are detected in the microarray, with their interactions as known from literature. Over- and under-expressed genes are shown in yellow or grey, respectively. In italics are indicated genes, which are detected in the comparison V12M2 cells vs. AX2 growing on bacteria. The vast majority of these genes is down-regulated. See text for comments. For the DDB ID numbers of the genes see Additional Files 1, 2, 3.

