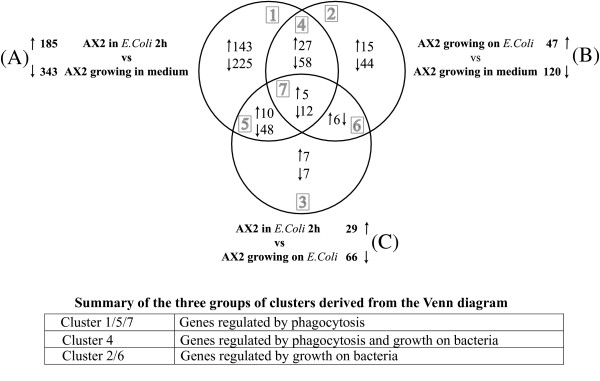
Figure 2.
Venn diagram of differentially regulated genes. The total number of up- and down-regulated genes in each comparison and the numbers of differentially regulated genes in the various clusters of the three comparisons are shown in black. Arrows indicate up- or down-regulated genes. The seven possible clusters of the diagram (grey numbers) can be grouped in three larger clusters (table below): cluster 1/5/7 includes genes regulated by phagocytosis, cluster 4 genes regulated by phagocytosis and growth on bacteria, and cluster 2/6 genes regulated by growth on bacteria. "Phagocytosis" means all stimuli that may arise from bacterial binding to the membrane, particle uptake, phagosome intracellular traffic; "growth on bacteria" means stimuli arising from metabolic adaptation to the different nutrients in bacteria vs. axenic medium. See text for details.

