
Figure 1. Insulin-stimulated GLUT4 translocation is not proportional to Akt phosphorylation.
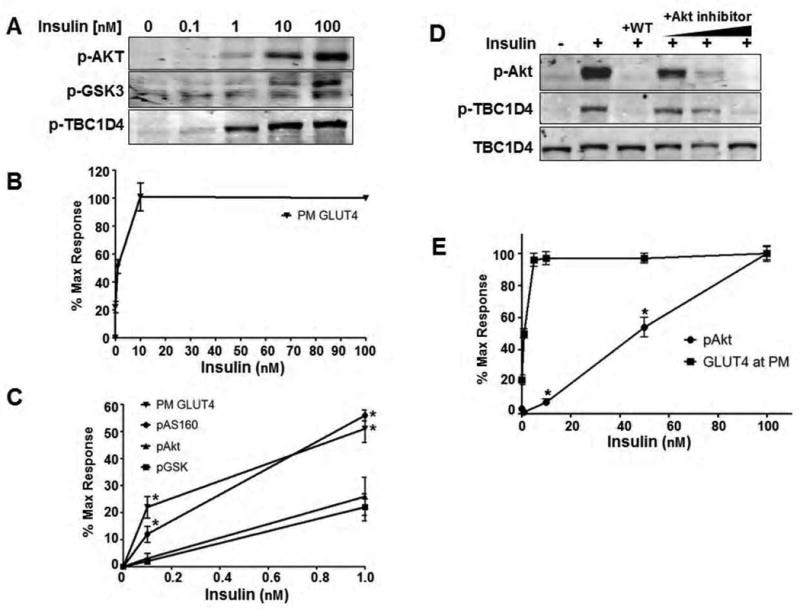
A) 3T3-L1 adipocytes were treated with a dose response of insulin. At each dose, the phosphorylation status of Akt at Ser473, GSK3α/β at Ser9/21, and TBC1D4 at Thr642 were detected by Western blot.
B) Insulin dose response for GLUT4 translocation to the plasma membrane in 3T3-L1 adipocytes.
C) To directly compare the insulin-stimulated response of each parameter in A) and B), the Western blots and translocation data were quantified and normalized to 0 and 100nM insulin representing minimal and maximal stimulation. An evaluation of submaximal stimulation reveals a distinct non-linearity between Akt phosphorylation and GLUT4 translocation to the plasma membrane. However, phosphorylation of TBC1D4 at submaximal insulin levels is more consistent with GLUT4 translocation than Akt, indicating an increased activity toward this substrate over others like GSK3. Error bars, ± s.e.m. of 3-4 experiments. *P<0.05 relative to Akt phosphorylation at the given dose of insulin, Student's t-test.
D) The PI3K inhibitor wortmannin (WT, 100 nM for 10 min prior to insulin) and an Akt inhibitor (at concentrations of 0.1, 1, and 10 μM) inhibit Akt phosphorylation and subsequent phosphorylation of TBC1D4 in 3T3-L1 adipocytes treated with 100 nM insulin for 12 minutes indicating that Akt is the sole insulin-regulated kinase acting on this site. Representative Western blots of 3 separate experiments are shown.
E) Insulin (20 minutes) was added to L6 myotubes at the concentrations indicated and the response of Akt phosphorylation and GLUT4 translocation were analyzed as a percent of maximal stimulation. Error bars, ± s.e.m., n= 3. *P<0.05, Student's t-test.