
Figure 1.
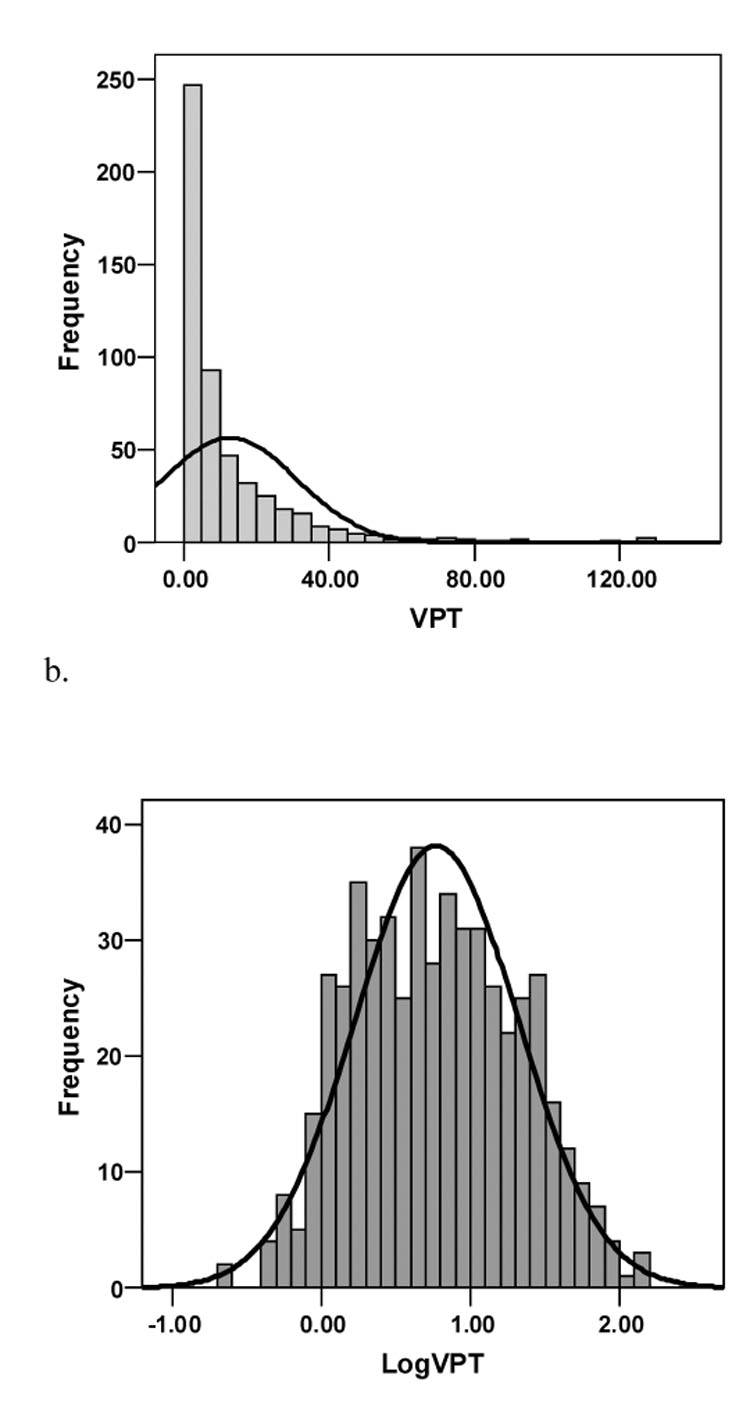
Vibration perception threshold (VPT) data were significantly skewed (a). Therefore, data were log10 transformed to achieve normal distribution (logVPT) (b).
Official websites use .gov
A
.gov website belongs to an official
government organization in the United States.
Secure .gov websites use HTTPS
A lock (
) or https:// means you've safely
connected to the .gov website. Share sensitive
information only on official, secure websites.
Vibration perception threshold (VPT) data were significantly skewed (a). Therefore, data were log10 transformed to achieve normal distribution (logVPT) (b).