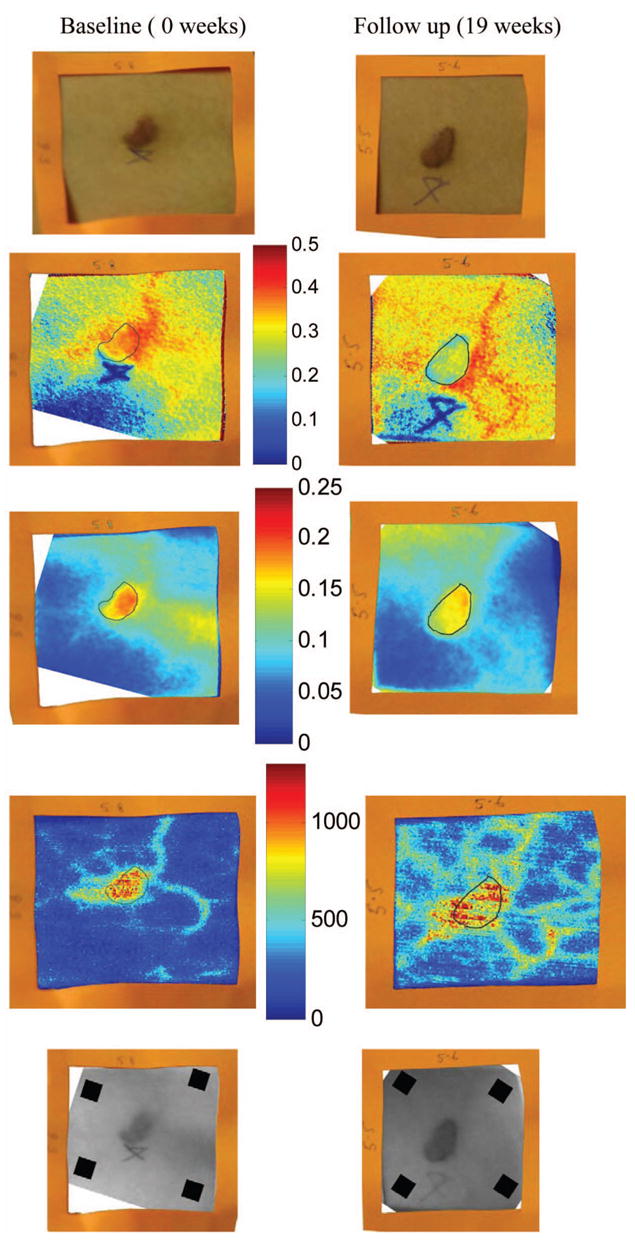
Fig. 10.

Images of Kaposi’s sarcoma subject receiving antiretroviral therapy (left column) upon entry onto protocol at 0 weeks and (right column) follow-up 19 weeks later: (top) digital image; (row one) reconstructed map of oxygenated hemoglobin; (row two) reconstructed map of blood volume; (row three) laser Doppler images; and (row 4) 700-nm spectroscopic image showing the four ROIs used to average the oxygenated hemoglobin and blood volume outside the lesion. This patient had a clinical diagnosis of progressive disease before the follow-up visit. Decreased oxygenated hemoglobin fraction, blood volume, and blood flux in the lesion are apparent at the follow-up visit. Increased overall vasculature and oxygenated hemoglobin can be seen in the laser Doppler and oxygenated hemoglobin images at follow-up.
