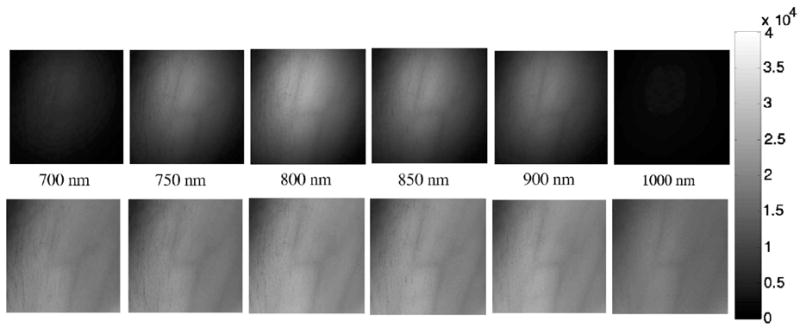
Fig. 2.

Spectral images of a normal subject’s arm at six NIR wavelengths (top row) before any calibrations and (bottom row) after intensity, source, and camera calibrations. The gray-scale bar shows the intensity of the reflected light. Note that tissue image intensity is normalized after the calibrations.
