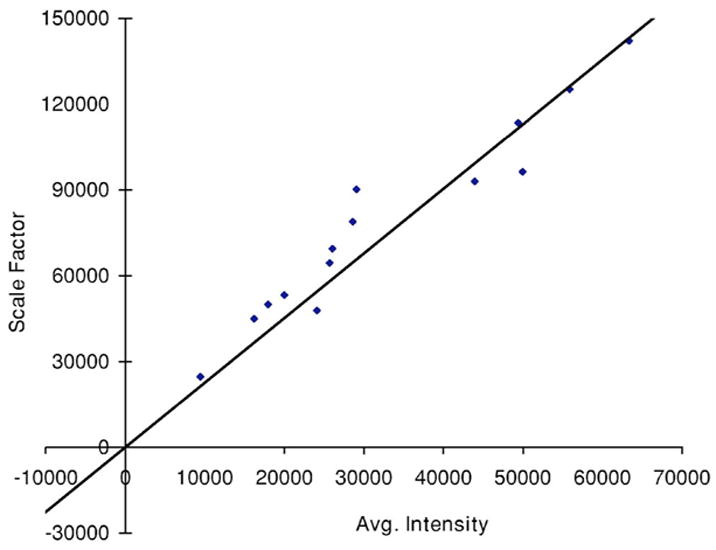
Fig. 3.

Fit of the standardized scaling factor that is used in Eq. (1) (R2=0.8839). This factor is different for each person and each visit. Each point on the graph indicates a normal subject with reasonable values of tissue oxygenation and blood volume based on published data.
