
Fig. 5.
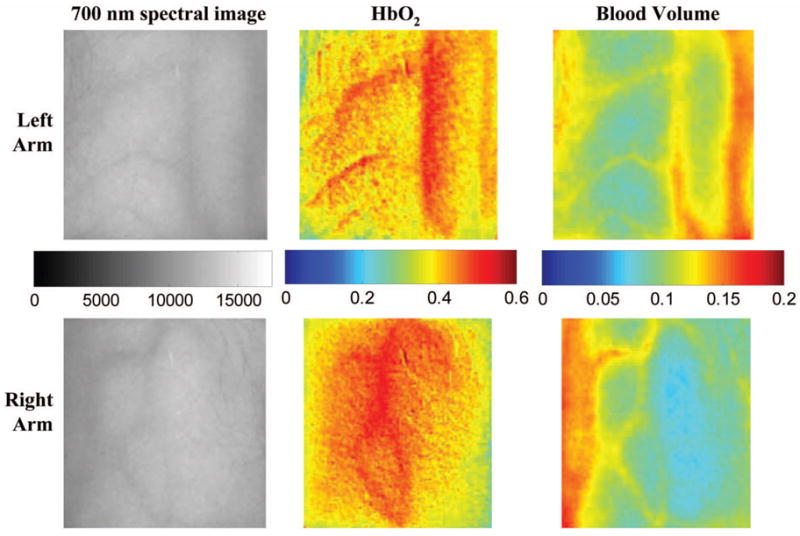
Images comparing a normal subject’s left and right forearm. Column 1 shows the calibrated 700-nm multispectral images collected from the system of each forearm. Column 2 shows the spatial maps of blood volume (Vblood) and oxygenated hemoglobin (Voxy) that were reconstructed from the set of NIR spectral images. Note that both arms show similar quantitative values for oxygenated hemoglobin and blood volume.