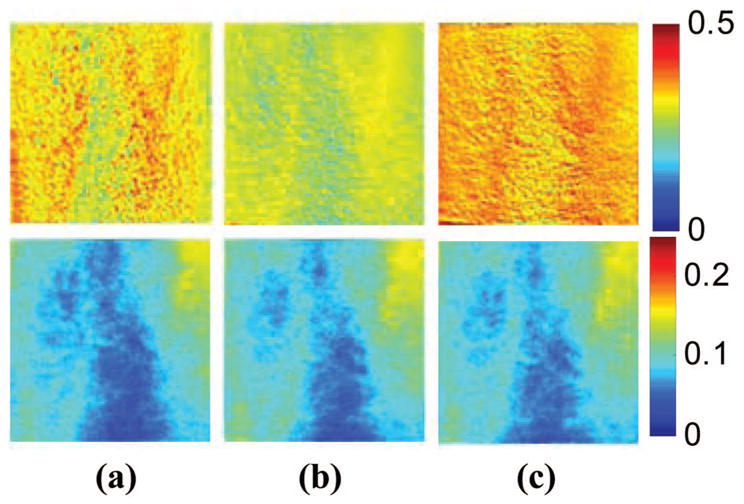
Fig. 6.

Experiment showing (top row) oxygenated hemoglobin and (bottom row) blood volume during occlusion showing reactive hyperemia: (a) 0 min, (b) after 5 min of occlusion, and (c) 1 min after releasing occlusion. During the occlusion, Voxy decreased and then when the occlusion was released, Voxy increased above the initial state. A slight increase in Vblood was seen after a 5-min occlusion period.
