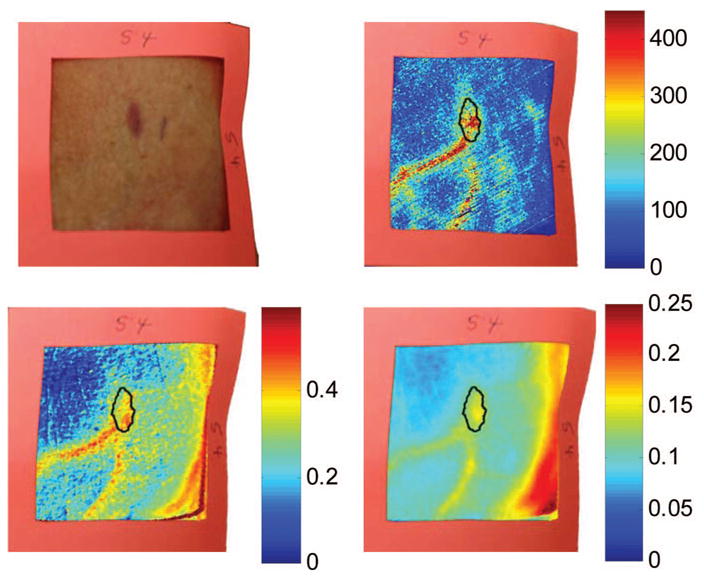
Fig. 8.

Images of Kaposi’s sarcoma subject on entry onto drug treatment protocol: (top left) digital image; (top right) laser Doppler image showing blood flux; (bottom left) reconstructed map of fraction of oxygenated hemoglobin; and (bottom right) reconstructed map of fraction of blood in tissue. There is increased blood flux, blood volume, and fraction of HbO2 in the lesion compared to the surrounding tissue.
